


EURJPY: 4-Hour
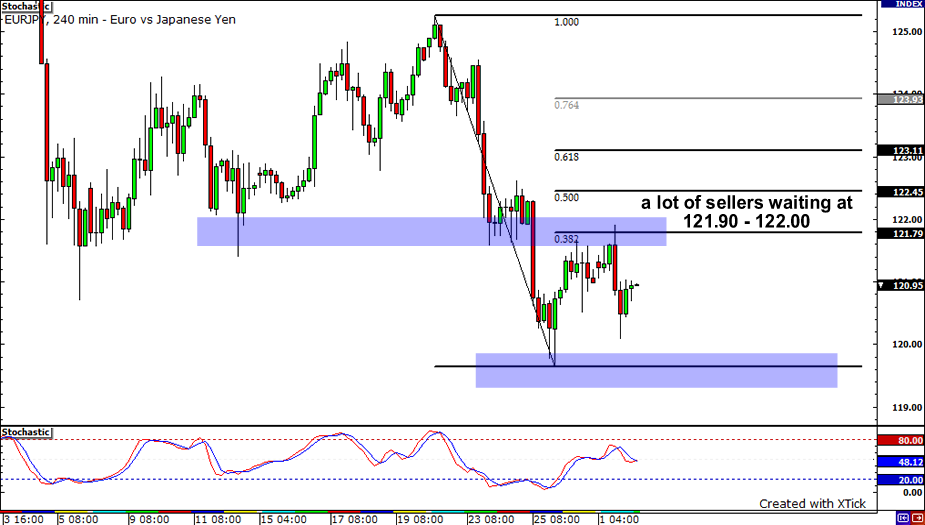
In yesterday’s update, I mentioned how the EURJPY could climb to the 50% Fibonacci retracement level before sellers would bring it down. I was a bit too conservative with my estimate as price quickly dropped when it hit the 38.2% Fibonacci retracement level. In any case, it seems that price is currently making its way to last week’s low, around the 120.00 region. I’d watch this level carefully as a break in this region could really push the EURJPY over the cliff and take it to as low as 116.00.
EURUSD: 4-Hour
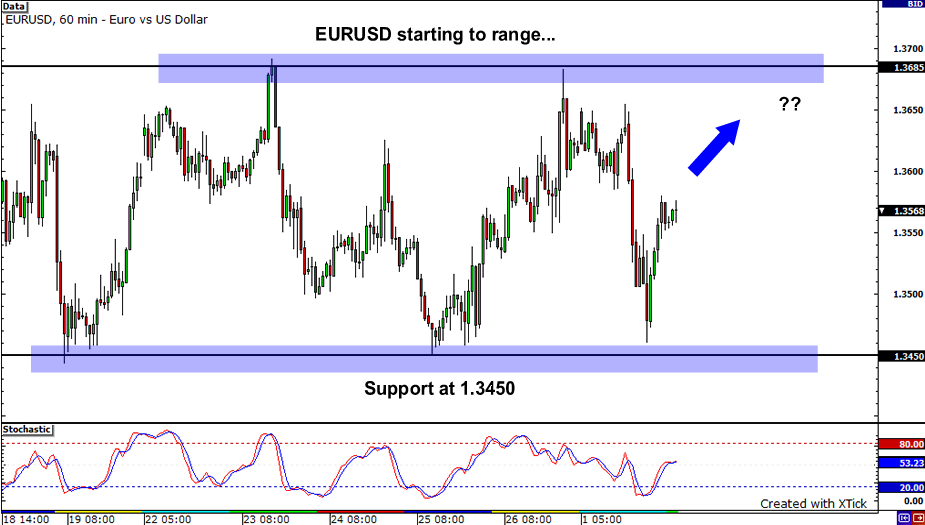
Is it just me or are y’all also seeing that the EURUSD is starting to form a nice rectangular range? Look at how price managed to find resistance twice at 1.3680 and support three times at the previous week’s low at 1.3450. Now that price has already bounced from support, would we see a move towards the top of the range? If price does manage to make it to 1.3680, we could see the bears quickly take the pair down, especially if stochastics hit overbought territory.
NZDUSD: 4-Hour

Lastly, lets end with a a look at the the Kiwi. The pair has been consolidating as of late, and has been forming a symmetrical triangle on the 4-hour chart. Currently, the pair is sitting just below the falling trendline, while bearish divergence appears to be forming. If the resistance holds, we could see price drop and test the support line around 0.6900. On the other hand, if buying pressure is strong and resistance fails to hold, we could see the pair shoot as high as 0.7150.


