


EURJPY: 4-Hour
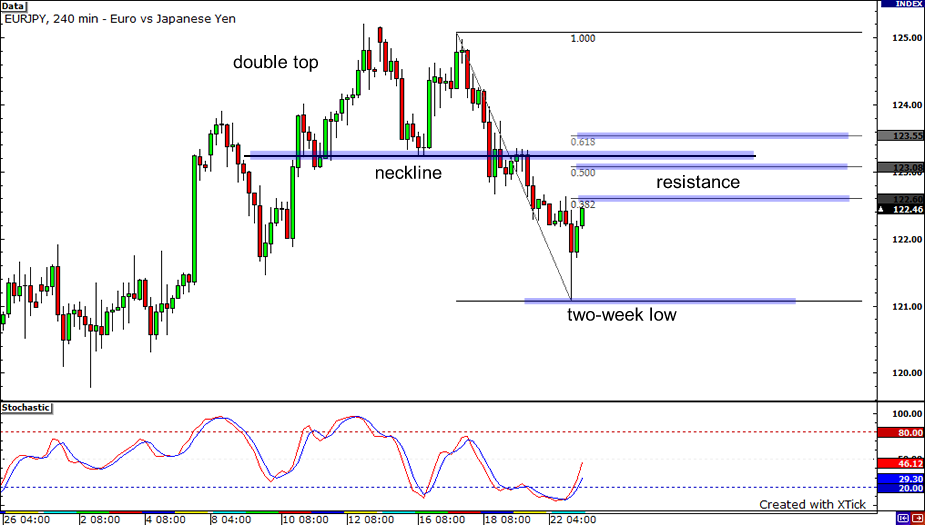
Let’s first take a look at the 4-hour time frame of the EURJPY pair. As you can see, the pair has been rallying after breaking down from a double top formation and touching a low of 121.06. With conditions far from being overbought as indicated in the stochastics, the pair could still retrace some of its recent losses. It, however, could find some resistances at the Fibonacci levels that I drew and at the former neckline before probably heading south once more. If it moves lower, then it will likely hit its two-week low again.
AUDUSD: 4-hour

Now let’s head over to the Land Down Under and check out the AUDUSD 4-hour chart. There has been a long-term ascending trend line connecting the lows of the pair. The pair recently bounced from this trend line and climbed up to the psychological 0.9200 handle, which seems to be an area of interest for the pair. If the pair breaks above the 0.9200 level, it could rise and retest the previous high of 0.9252. On the other hand, if the pair drops down and breaks the trend line, it could fall down until the next support level in sight, which is at the former resistance level around 0.9075.
USDCHF: 4-Hour
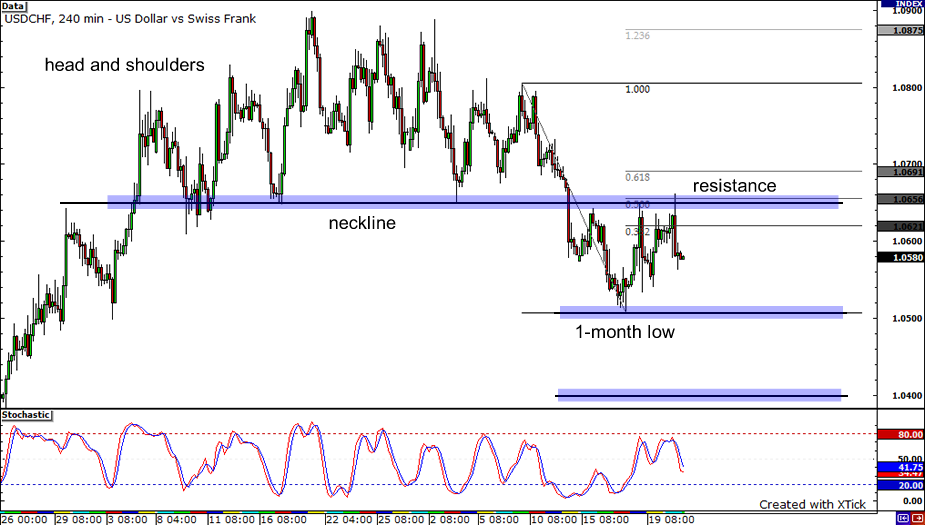
Next is an update of the USDCHF chart that I drew last week. Remember when I told you that the pair could rally back to the head and shoulders former neckline? That’s exactly what transpired yesterday! Lucky guess. Anyway, the pair tried to move past 1.0650 but its ascent was halted by the resistances at the former neckline and at the 50% Fibonacci retracement level that I marked. With its momentum turning lower, it could now continue its trek downward until it finds some minor support at its 1-month low. Its next stop would probably be at the 1.0400 handle if it’s able to break its 1-month low.


