


AUDJPY: 4-Hour
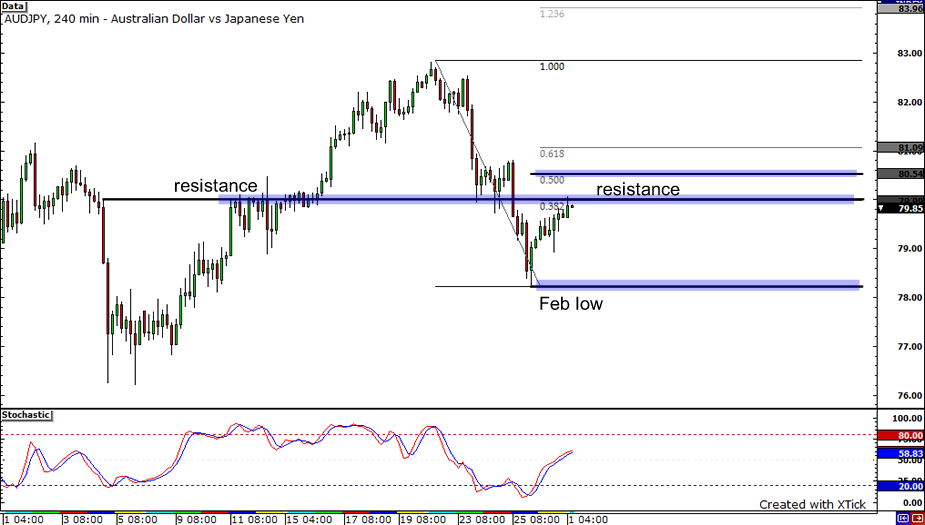
Let’s first take a look at the AUDJPY pair on its 4-hour chart. As you can see, the pair is now correcting back to the 80.00 handle after falling to a low of 78.19 during the last week of February. Magically, the 80.00 mark perfectly falls in line with the 38.2% Fibonacci retracement level that I drew. The pair could have a hard time moving past this level and could fall back down to its February 26 low if the resistance at 80.00 holds. On the flip side, the pair could reach the next Fib level which is at 80.54 if 80.00 breaks.
EURJPY: 4-hour
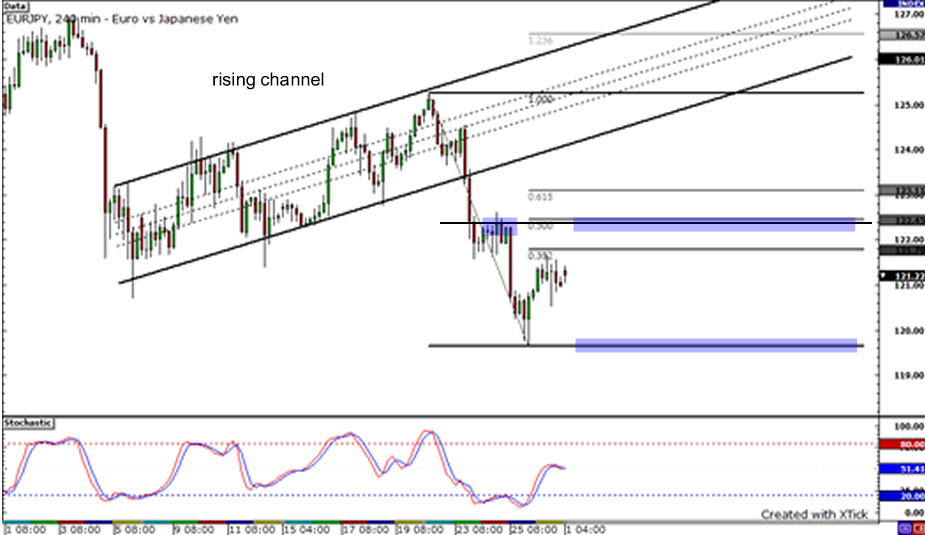
Now, let’s take a look at the EURJPY 4-hour chart. As you may notice, the pair broke below the rising channel last week and continued to drop to a low of 119.65. Sellers must’ve been really exhausted from making the pair dive by more than 500 pips! Right now, the pair is pulling back a bit, possibly to retrace until the 50% Fibonacci level. This lines up with an area of interest, right around the 122.50 mark. After retracing, the pair could fall back and even break the recent low of 119.65. However, if sellers no longer have the upper hand, the pair could surge past the 61.8% Fibonacci retracement level and retest the bottom of the broken channel.
USDJPY: 1-Hour
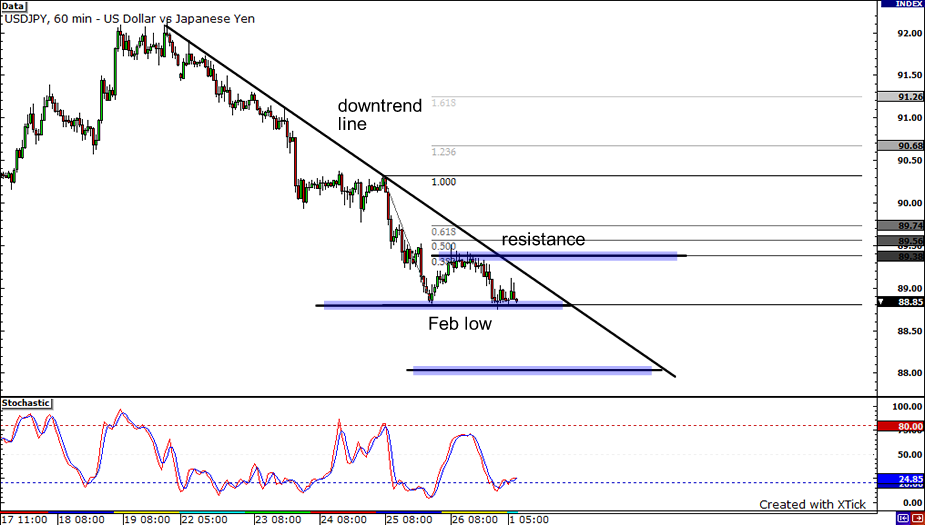
Next is the USDJPY on its 1-hour chart. As you can see, the pair is on a downtrend and is likely to remain there until we see a clear sign of reversal. During the last trading day of February, it hit a resistance at its 38.2% Fibonacci retracement level after correcting from its February low. It then fell back and revisited the same low. Presently, the pair is hovering above 88.85. Judging from last Friday’s range, it could drop all the way down to the 88.00 handle if it falls below last month’s low. On the other hand, it could rise back up its 38.2% Fib if it breaches its downtrend resistance.


