


EURJPY: 1-Hour
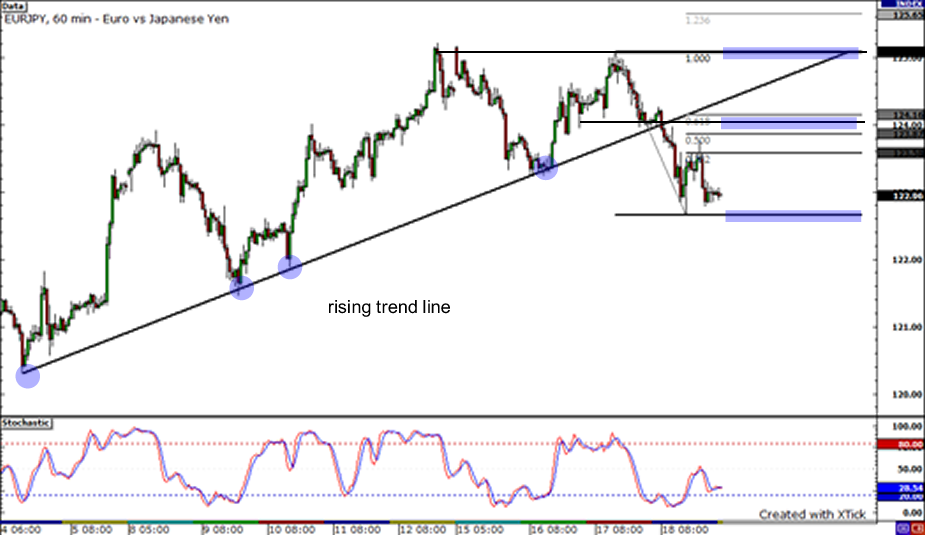
Let’s kick off with the EURJPY pair on its 1-hour time frame. The rising trend line, which was formed around the beginning of March, has been broken recently. This suggests that the pair’s uptrend could start to reverse, especially if the pair is able to retest the broken trend line. It already dropped after retracing to the 38.2% Fibonacci retracement level but the stochastics seem to indicate that the pair could climb back up. If it does, it could retrace until the 61.8% Fibonacci level or even pullback as high as the 125.00 handle, at which the pair encountered resistance.
USDCAD: 1-Hour
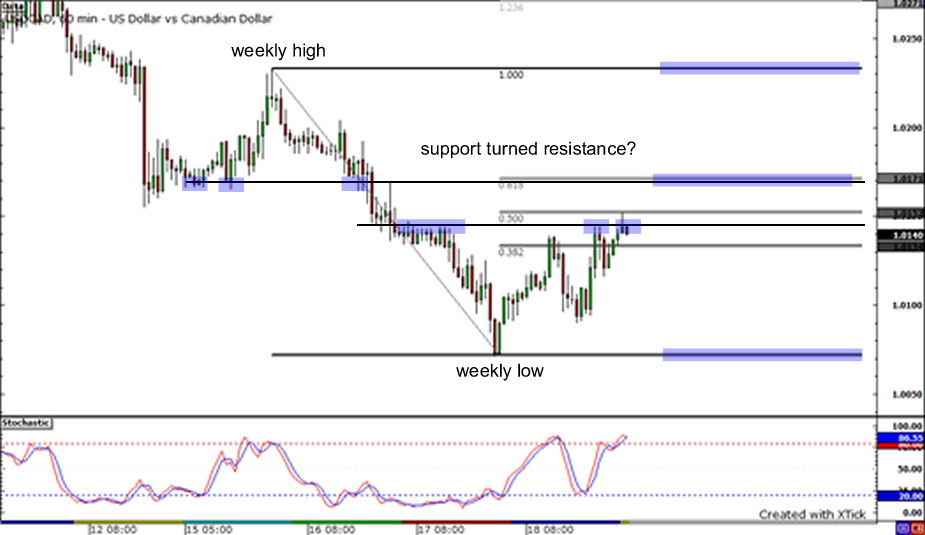
Check out the USDCAD 1-hour chart I posted above! The loonie has been on a tear, giving the USDCAD a nice strong downtrend. However, loonie bulls had to pause and catch their breath yesterday, allowing the pair to retrace until the 50% Fibonacci level. This area served as a resistance level for the pair and could hold. If it doesn’t, the pair could still pull back to the 61.8% level, which lines up with a former support level. But if the pair breaks past these levels, it could surge up to its weekly high of 1.0232. Otherwise, it could tumble back down to its weekly low of 1.0071.
USDCHF: 4-Hour
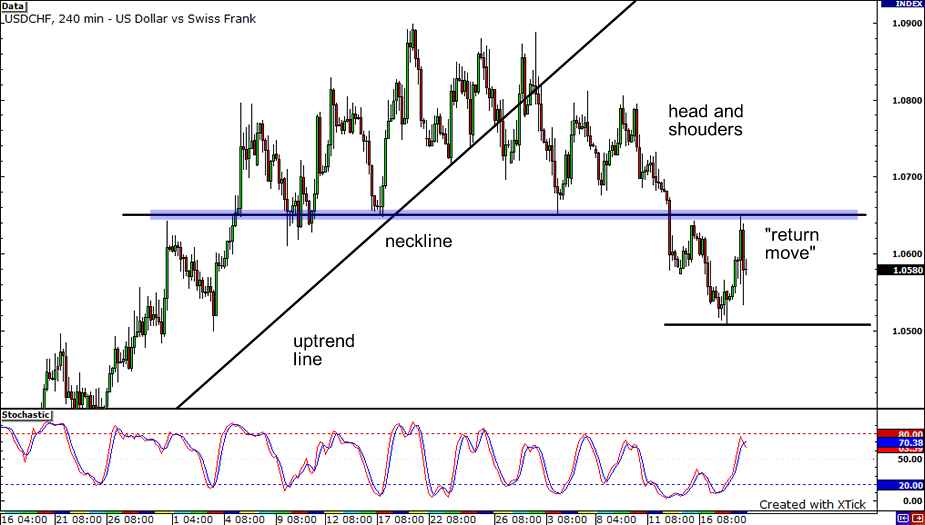
Remember the head and shoulders formation that I saw on the USDCHF the other day? Well, guess what?! After breaking down from the formation, the pair rallied back a couple of times to test the former neckline. Unfortunately for the USDCHF bulls, the resistance at that level was tough. The pair fell back again after reaching 1.0650. Presently, it is trading just below 1.0600. With stochastics far from being overbought, it can still move north until it sees a wall at 1.0650. But if sellers jump in, then it could probably hit yesterday’s low again.


