


USDCHF: Daily

Is that a long term rising trend line I spot on the daily chart of the USDCHF? Why, yes it is! After topping out at 1.0899, the pair has retraced and is now testing the 50.0% Fibonacci retracement level. With stochastics showing oversold conditions and bullish divergence forming, we could see a reversal if price actually tests trend line. If the support line holds and buyers come back in force, we could see the pair reverse and test former highs. On the other hand, if selling pressure remains strong, price could pierce through the support line and head all the way down south to 1.0140!
EURJPY: 4-hour
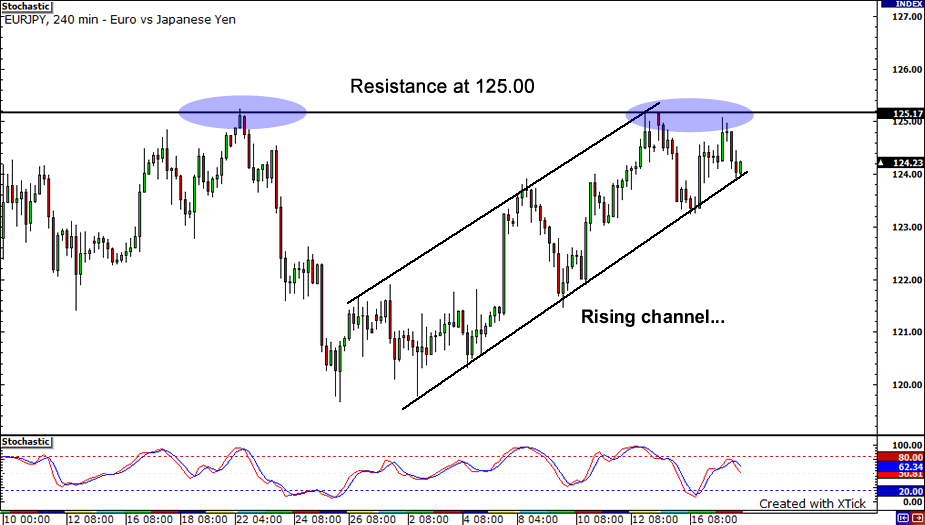
After channeling up the past week or so, it seems that the EURJPY has finally hit a significant barrier right at last week’s high. The important levels to watch now are 124.00 and 125.20. If sellers manage to take price below yesterday’s low, that would lead to a break in the ascending channel and cause price to drop to previous lows. Conversely, if buyers are able to push price above 125.20, price would probably fly to 127.00 before encountering any major resistance.
GBPJPY: Daily
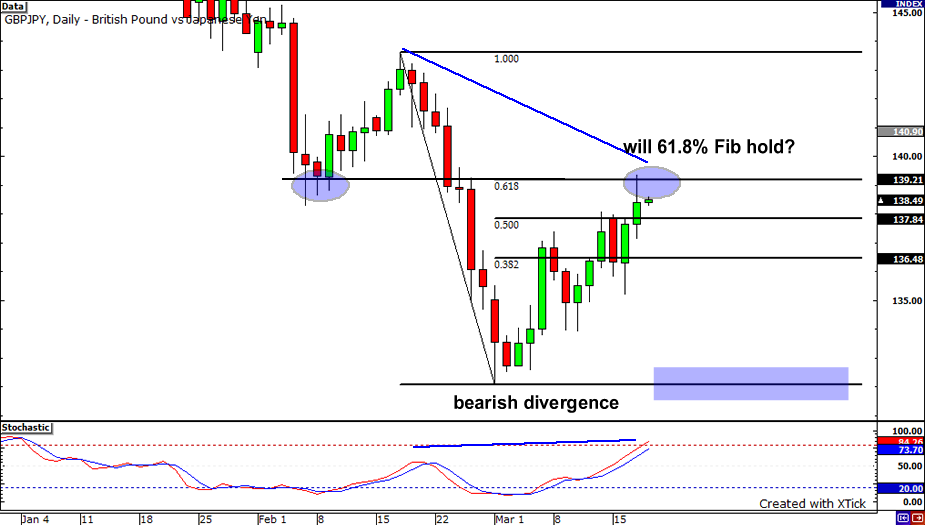
It looks like a bunch of sell signals has popped up on the GBPJPY daily chart. For one, price just bounced from the 61.8% Fibonacci retracment level. Secondly, that Fib level also coincides with a previously broken support. Remember, whenever support level breaks, that level becomes resistance. Thirdly, price made lower highs while stochastic made high highs, forming a clear bearish divergence. If sellers start jumping in, a move towards 132.00 is likely. On the flip side, if a daily candle manages to close above the 61.8% Fib, the bulls would probably take the pair all the way to former highs at 143.60.


