


GBPUSD: 4-hour
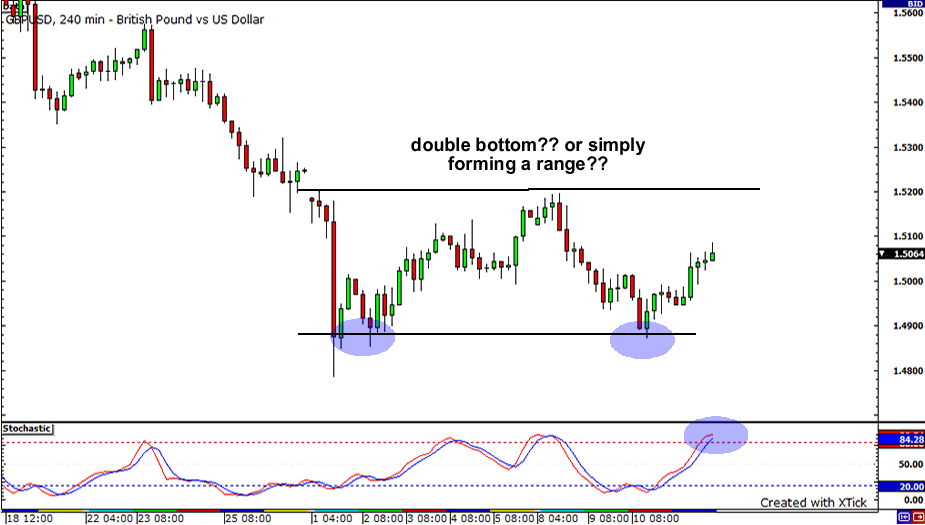
Let me go out on a limb here and say that maybe, just maybe, the Cable bears are starting to get tired. I say this because a double bottom formation is beginning to form on its 4-hour chart. Look at how support around the 1.4850-1.4870 area has held this week, keeping the Cable from sinking to new yearly lows. With that said, watch carefully whether resistance at 1.5200, the previous week’s high, would hold or not. The overall trend suggests that we could see mad sellers in that area, especially since stochastic is at overbought territory, but keep your eyes peeled just in case!
EURUSD: 4-hour

Moving on to the EURUSD, we can see that the pair’s trading range remains intact for the third week in a row. Notice how 1.3700, a major resistance level and a psychologically significant number, has kept the pair from staging any serious rallies. With price slowly crawling back to resistance and stochastics at overbought territory, would we see another another drop down? If resistance does hold, watch out for a move towards 1.3550, as that level has held as support two times before. Conversely, if a 4-hour canlde manages to close above 1.3700, the pair’s next stop could be former highs at 1.3800.
USDJPY: 4-hour
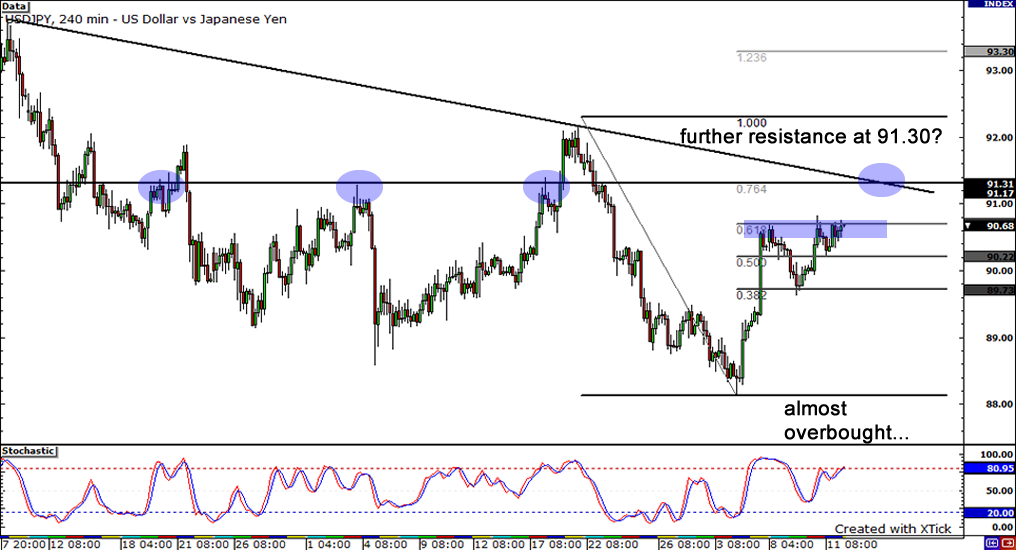
Lastly, lets end with a look at the USDJPY. It looks like that 61.8% Fibonacci retracment level is really holding! Price has stalled at the 90.70 and with stochastics almost indicating overbought conditions, will we see another reversal? If resistance holds, we could see price dip and test support around 89.75. On the other hand, if buyers continue to drive price action up, we could see the pair rise and test a falling trendline at around 90.30.


