


USDCHF: 4-hour
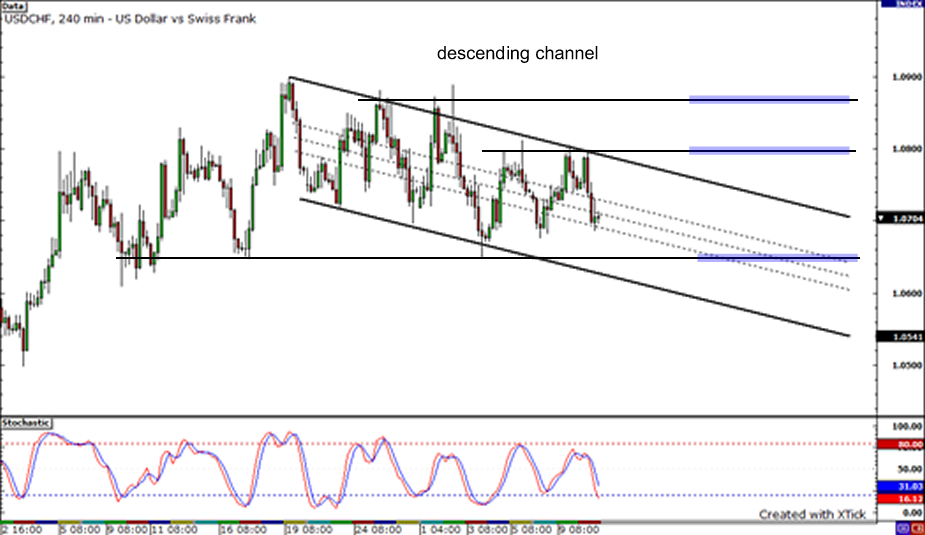
Check out the USDCHF 4-hour chart I showed you above. The pair has been moving in a descending channel for almost a month now. After hitting the top of the channel yesterday, the pair proceeded to move lower, possibly to test the bottom of the channel soon. However, there seems to be a support level at the 1.0650 area and the pair could bounce back up after reaching that level. It could climb and test the top of the channel again, unless it encounters resistance near the psychological 1.0800 handle. If its upward momentum is strong enough to break above the channel, it could encounter another resistance level at the 1.0875 area.
USDCAD: 1-Hour
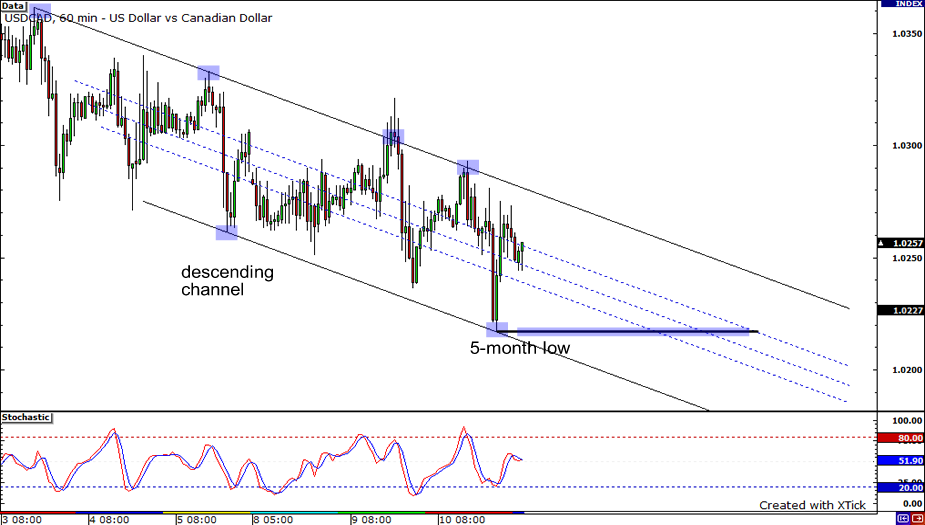
Check out that nice descending channel in the USDCAD’s 1-hour time frame! Yesterday, the pair raced back to 1.0293 but was halted by the channel’s resistance. It then sunk all the way down to the formation’s support only to be pushed back up again. Presently, the pair is trading at around 1.0250. It will probably head downward until it breaks up from the pattern. So if the Loonie buying remains, it can once again revisit its 5-month low or even go lower.
AUDUSD: 4-Hour

Next is the AUDUSD pair on its 4-hour chart. Well, the pair has been on an uptrend since February 6. It will probably move higher especially now that sentiment is turning bullish. Conditions as indicated by the stochastics, however, are already overbought. Given this, the pair could correct for a while, possibly somewhere around 0.9070, before heading back north.


