


GBPUSD: 4-Hour

After retracing back to the 1.5200 handle, the GBPUSD pair headed back down. Taking a look at the 4 hour chart, it looks like that 61.8% Fibonacci retracement level held pretty nicely! With stochastic just exiting oversold conditions, could we see the pair retrace back up to test the 1.5200 handle? Now, if we see a candle close below support at 1.4940, it may signal that selling pressure is still strong and that the pair may just fall all the way down to test the recent swing low at 1.4785.
USDCHF: 4-Hour
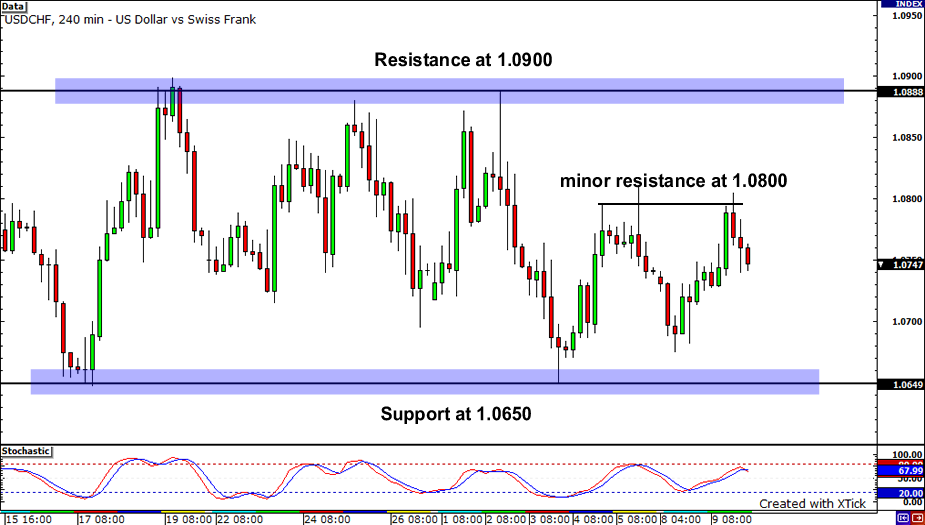
If you’re one of those range traders types, you’re probably just loving how the USDCHF is looking! Look at how that pair has been bouncing around a nice 250-pip range with resistance at 1.0900 and support at 1.0650. Yesterday, however, price was unable to make its way to the top of the range and found resistance immediately at 1.0800. With stochastics doing a bearish crossover, it seems that an early retest of support at 1.0650 is in the cards. I’d watch that support carefully, as the bulls could start jumping in at that level.
USDCAD: Daily
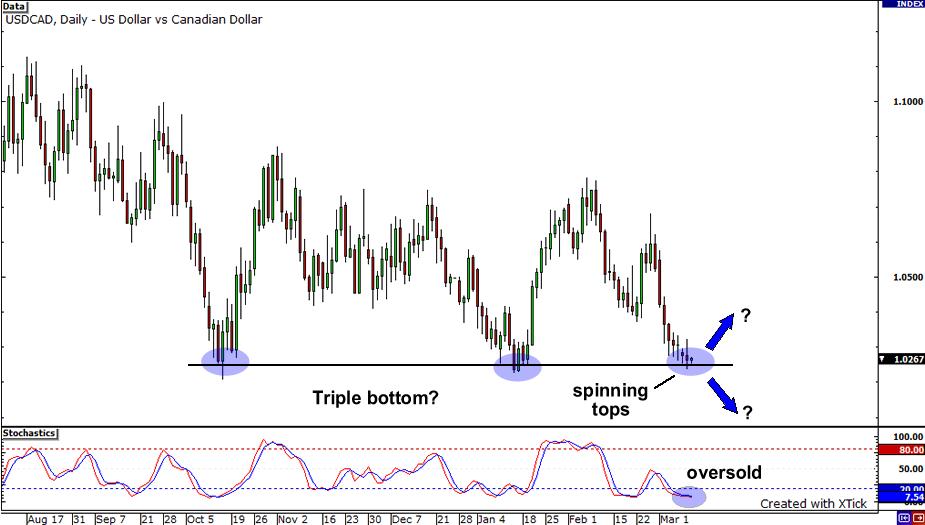
Lastly, I’ve got the USDCAD for you. Don’t look now, but the pair has now dropped the last EIGHT trading days! However, a couple signs of reversal have popped up. For one thing, spinning tops can be found just a few pips above support at 1.0250. Secondly, the USDCAD seems to be in the middle of forming a triple bottom. Thirdly, stochastics indicate that the pair could be oversold. If support holds, a bullish candle may signal the start of a reversal. Conversely, if we see a candle close below the recent lows, we may just see the pair head for parity!


