


GBPUSD: 1-hour
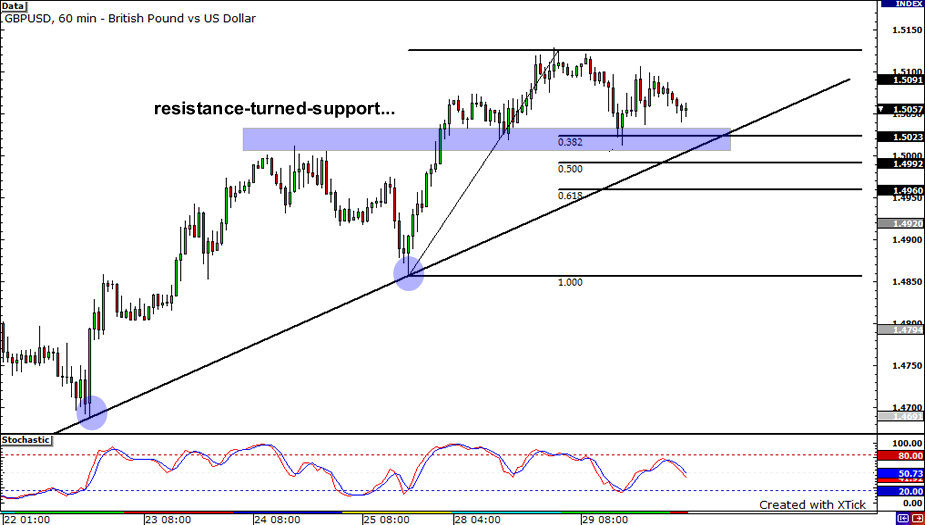
Confluence – that’s what the GBPUSD is all about today. Huh, what the heck does that complicated term mean? Confluence is when several technical indicators give the same trade signal. In this case, we can see that the rising trend line, the 38.2% Fibonacci retracement level, and the resistance-turned-support level line up nicely and point to a continuation of the pair’s uptrend. If you’re bullish on the pair, keep an eye out for the support zone at the 1.5000 to 1.5030 region for a possible entry. On the other hand, if you’re bearish for the pair, look for a convincing candle close below the rising trend line, as it would open up 1.4858 for the sellers.
EURCHF: 1-hour

Lemme take one out of Cyclopip‘s playbook and break it down for ya. Recently, every time EURCHF has consolidated, the pair has broken to the downside, making all-time lows. With the pair forming another bearish pennant formation, it seems like traders are gearing themselves up for another down move… Look for a bearish candle that breaks yesterday’s lows to confirm that selling pressure remains strong.
AUDJPY: 4-hour
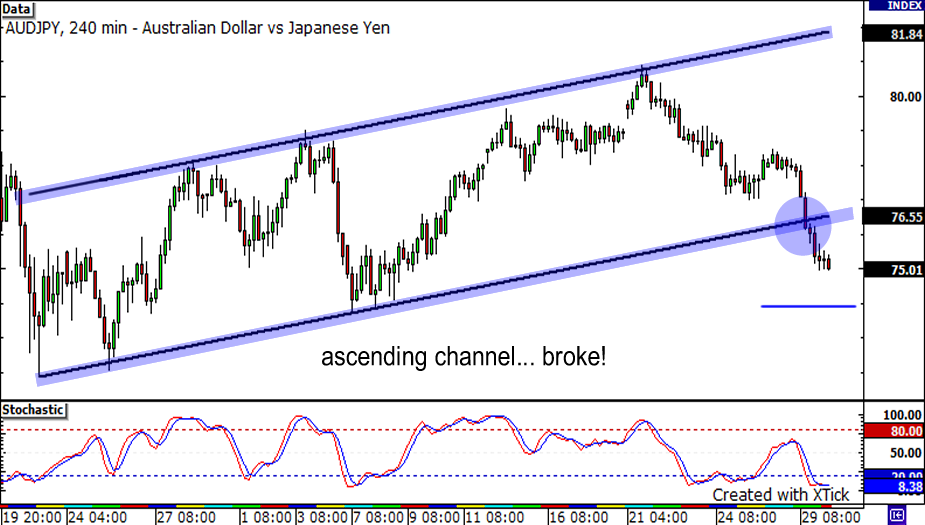
Whoa, baby! Did ya’ see that? In one swift move, AUDJPY broke out of its ascending channel! Now, if sellers ain’t done yet, look for them to keep bringing price down until support near the 74.00 handle. On the other hand, if buyers decide to jump in soon, we could see price retrace, before finding resistance around the broken rising former support line.


