


GBPUSD: Daily

Bulls beware! It looks like the Cable is revving up for another strong down move! As you can see from the chart I posted, price just bounced from the 38.2% Fibonacci retracement level and stochastics, though still hasn’t hit overbought conditions, it is very darn close! If candles fail to close above these Fib levels that go all the way to the 1.5000, expect the bears to come out strong and swinging with the intention to take the Cable lower for a retest of former lows.
AUDUSD: 4-hour
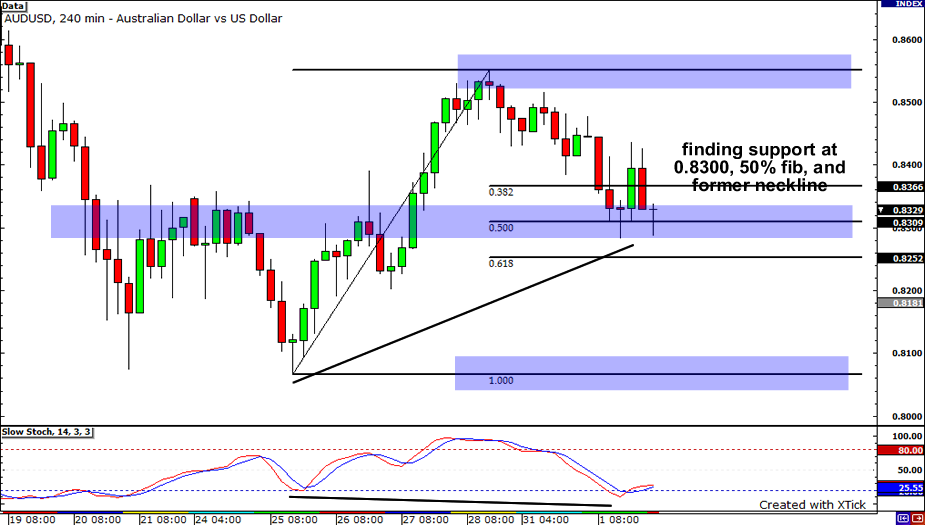
It looks like the Aussie is finding some kind support neckline of the double bottom chart pattern it broke out of last week! Is the Aussie poising itself for a strong move up? Firstly, a bullish divergence has formed. A bullish divergence is usually an early signal that price will turn. Secondly, price just bounced from the 50% Fibonacci retracement level, which nicely lines up with the 0.8300 psychological handle. And finally, stochastics show that conditions are oversold. If candles do not close below 0.8300, expect the AUDUSD to be bought up and retest last week’s highs at 0.8550.
EURJPY: 1-hour
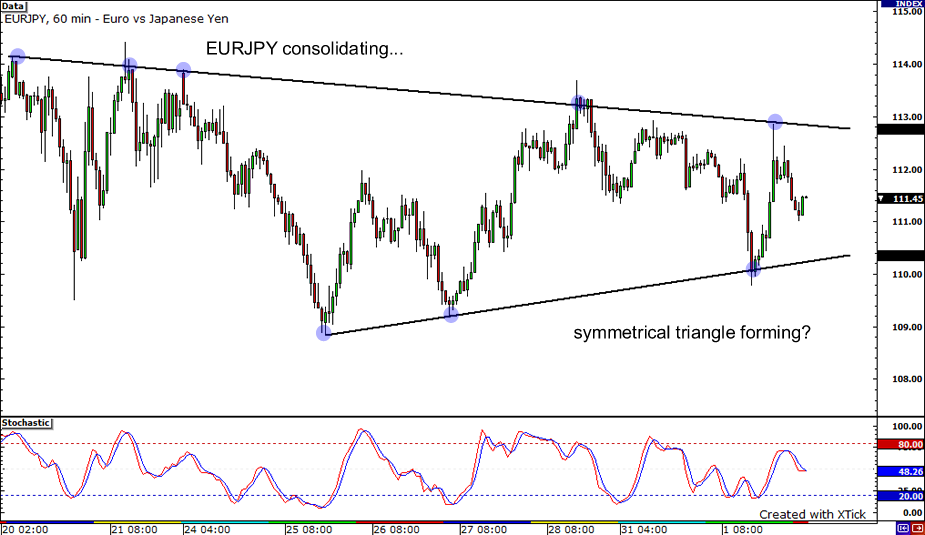
Is the EURJPY’s downtrend almost over? Looking at the 1-hour chart, I noticed that the pair seems to be consolidating. There’s a shallow falling trend line connecting the pair’s highs and, at the same time, there’s a rising trend line connecting its lows. It looks like a large symmetrical triangle is in the works! The stochastics are currently on middle ground, suggesting that the pair could head either way. If it moves up, it could find resistance at the falling trend line, probably around yesterday’s high of 112.85. If it edges lower, the rising trend line could provide support.


