


GBPJPY: 4-hour
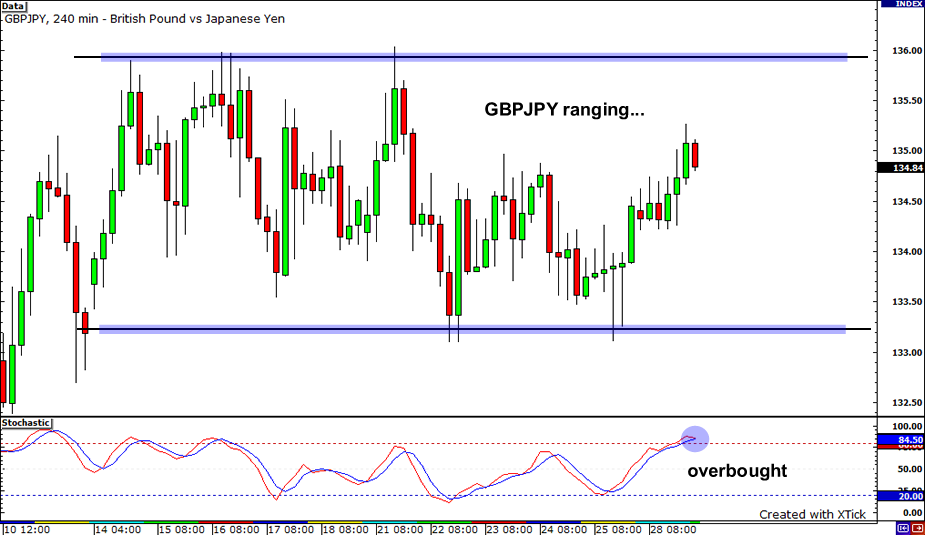
Up, down, up, down… GBPJPY has been stuck inside a range for more than a couple of weeks, bouncing up and down between support near 133.20 and resistance at 136.00. It has just rebounded after hitting the bottom of the range and seems to be aiming for the top again. With the stochastics in the overbought area, it can’t be long before buyers run out of steam. If they do, the pair could tumble back down to the bottom of the range.
EURJPY: 1-hour

It looks like EURJPY is ranging too, bounded by support around 109.50 and a shallow falling trend line connecting the pair’s highs. The pair is now sitting at the bottom of the channel, thinking of its next move. Since stochastics have been staying in the oversold area for quite a while already, the pair might decide to take the northbound direction. If it does, its uptrend could be cut short once it hits the falling trend line.
GBPUSD: 4-hour
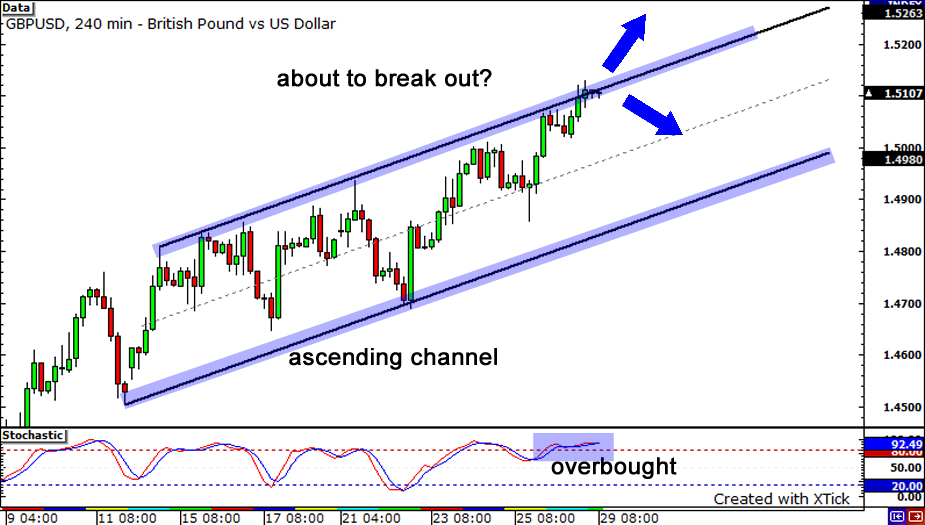
Lastly, let’s take a look at Cable. The pair has been stuck within an ascending channel the past couple of weeks, and has continued to make higher highs. With price now sitting right smack on resistance, are we in line for a breakout? Look for a candle close above the 1.5150 price area, which has been an area of interest in the past. A close above this price level could signal a stronger move up. On the other hand, stochastics are indicating overbought conditions, so we could see sellers jump back in. Don’t expect too much of a move down south though, as there could be strong support in the middle of the channel at 1.5000.


