


AUDJPY: Daily
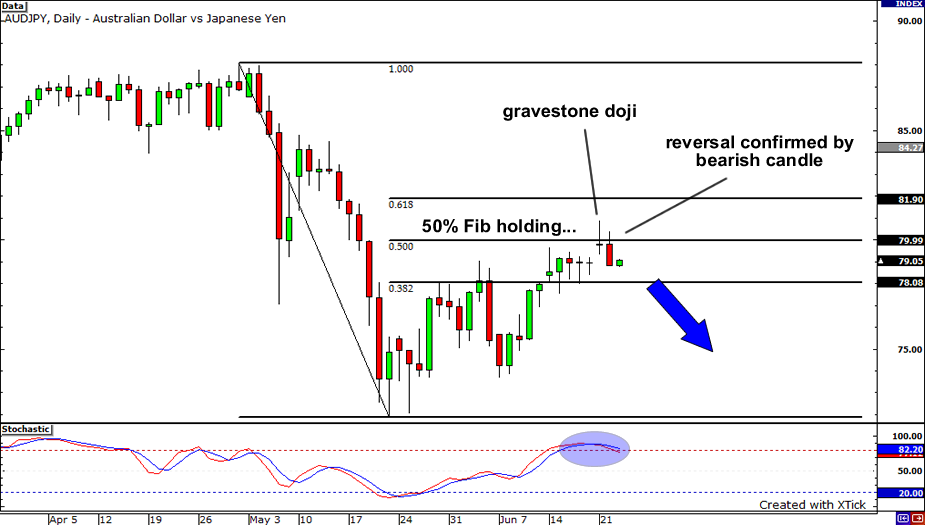
Candlestick analysis time! After rallying strongly last week, it looks like the AUDJPY is now running out of steam. A gravestone doji has formed right on the 50% Fibonacci retracement level, indicating that there is some resistance at the psychologically significant 80.00 handle. With the next candle a very bearish one and stochastics at overbought territory, we could see a move towards minor support at 78.00. Now, if the bulls manage to gather some strength and push price above the 50% Fib, expect the 61.8% Fib to be tested.
GBPJPY: 4-hour

Check out the ascending triangle formation on the GBPJPY 4-hour chart! The pair has been drawing higher lows but was unable to bust above the resistance near 136.00. The pair is sitting at the bottom of the triangle and, with the stochastics climbing out of the oversold area, the pair could also head higher. If the upward momentum is strong enough, the pair could even surge above the top of the triangle. However, if the sellers regain control, they could force a breakdown and probably push the pair down until support around 131.00.
USDJPY: 1-hour
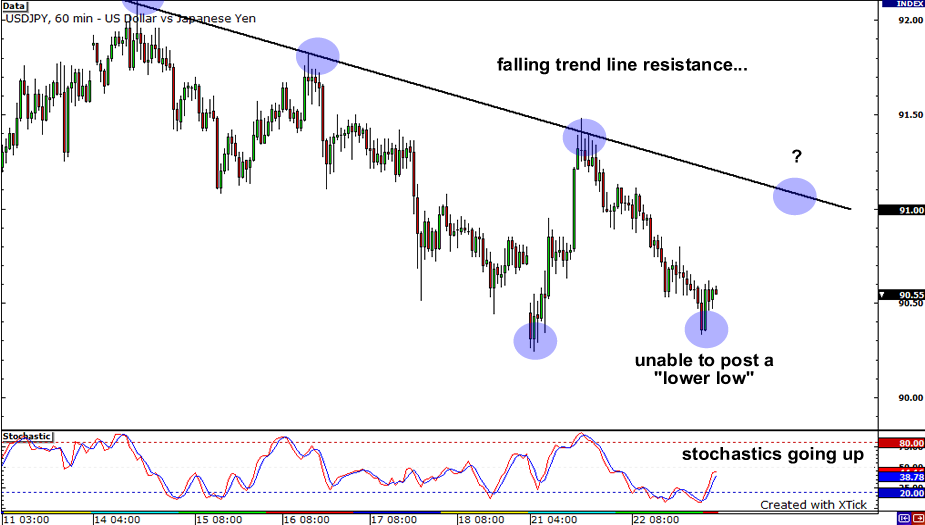
Hmm, it looks like the USDJPY bears have finally exhausted themselves as price was unable to make a new “lower low.” Stochastics is currently pointing up and with price edging higher slowly, we could see a retest of the falling trend line resistance at 91.00. Conversely, if price heads down instead, expect to see some tough buying support between 90.25-90.35.


