


EURGBP: 4-hour
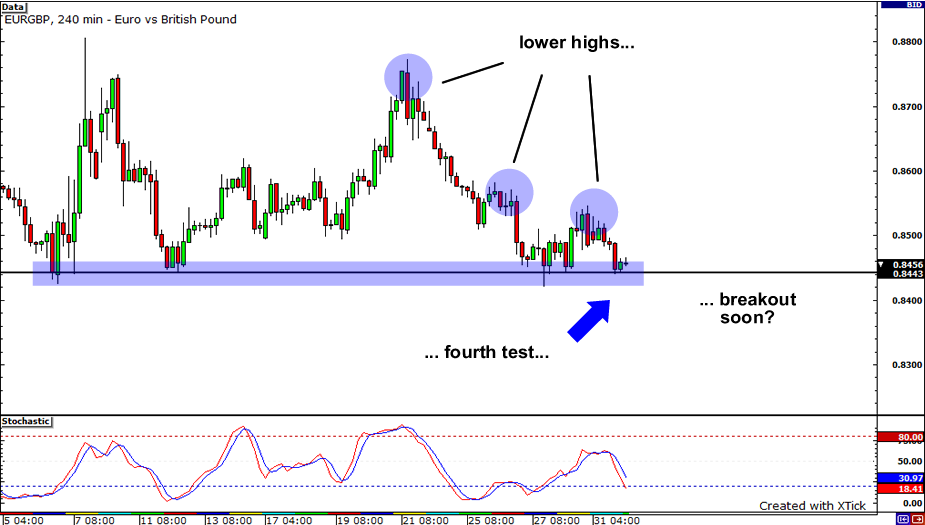
With traders coming back in full force from the long holiday weekend, we may see the EURGBP break a major support level today. For one, the pair has been making lower highs for the past few weeks. And two, as you can see from the chart, this is the fourth time the pair has tested this support level. Remember, the more times a support or resistance level is tested, the more likely it is to break. To confirm the break, look for a 4-hour candle close below 0.8420. If that happens, the 0.8300 level would be open for the taking for the bears. Conversely, if we see a clear rejection, expect the pair to climb back up to the 0.8550 region.
EURAUD: 1-hour
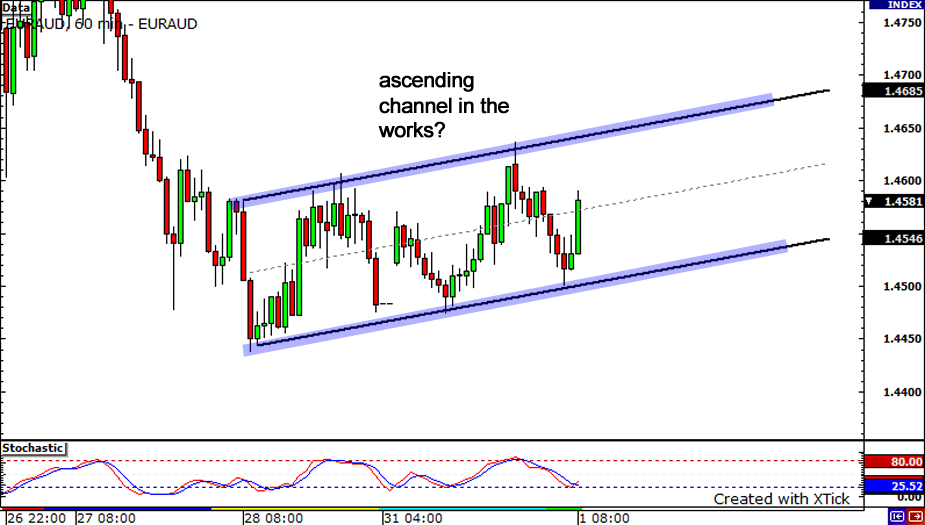
Is that a channel forming on the EURAUD? Why I think so! The last time this pair formed a channel, it held for a long, long time. Now, I’m not sure the same will happen now, but I’m sure Cyclopip will keep his one good eye out on this pair! With the pair just exiting oversold territory, we could see price jump up to test the upper bound of the channel, before finding resistance around the 1.4650 mark. Be careful though – this ascending channel has formed right after a steep drop. Could this be a sign of a bearish flag?
GBPCAD: 1-hour

Next, lets move on over to the 1-hour chart of the GBPCAD. Price action has been consolidating as of late, forming what looks to me like a falling wedge. Could this recent convergence lead to a breakout soon? With price action now chillin’ just above the support line and stochastics showing oversold conditions, we could see price bounce back up as buyers come back to play. Now, as price continues to consolidate, we could see a breakout. The only question is where could it go?! If it breaks to the top, we could see buyers push price back to the 1.5400 handle. On the other hand, if we see a break lower, we could see new lows established near the psychological 1.5000 mark.


