


EURGBP: 1-hour

That thing looks like it’s going to drop, baby! Using my trusty trend lines, I’ve connected the major highs and lows of the EURGBP to form a rising wedge chart pattern. A rising wedge is considered as a bearish formation, indicating that a possible break downwards will happen. In this case, look out for a convincing candle close below the rising trend line support, as it will open up the possibility of a move towards .8300 and .8270 for the bears.
USDCAD: 4-hour
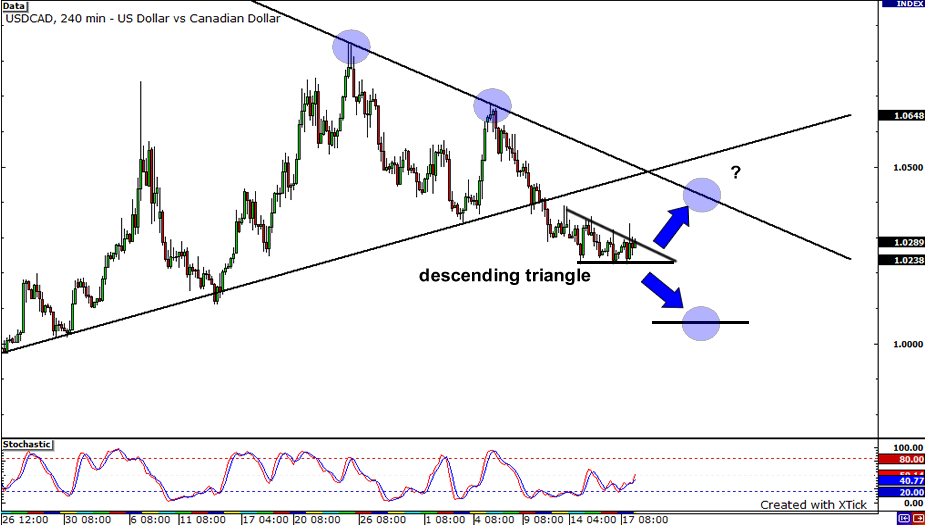
After breaking out of the head and shoulders pattern I pointed out a couple of days back, the pair has consolidated into a tight descending triangle. Considered as a bearish chart pattern, this triangle formation hints at a possible down-move soon. If support at 1.0220 breaks, we could see the pair head to the 1.0100 handle before finding support. Conversely, if the pair breaks out upward, its next stop would be the falling trend line around the 1.0400 price region.
EURJPY: 4-hour
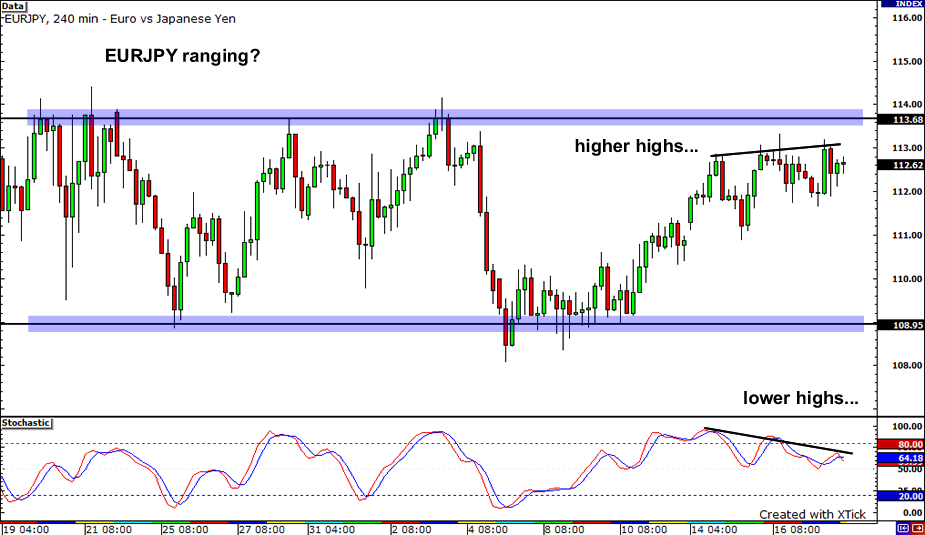
Up, down, up, down… It seems that the EURJPY pair is stuck within a range on its 4-hour chart. Check out how the pair found a floor around the 109.00 handle and a ceiling at 113.70. The pair has been climbing higher for almost an entire week, possibly to see if the resistance at 113.70 would hold. But is that a regular bearish divergence I see? The price has been drawing higher highs while the stochastics are showing lower highs. This suggests that downward price movement could be in the cards!


