


GBPUSD: 1-hour
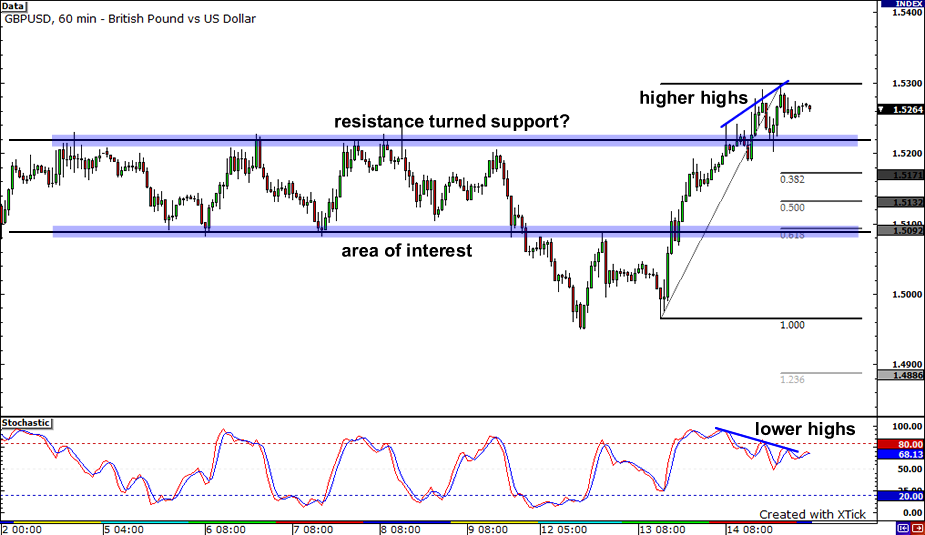
Cable just keeps rising, doesn’t it? It was able to break above that resistance level at 1.5230 and rallied all the way up to the 1.5300 mark. But, with the stochastics pointing down, could the pair’s upward movement be over? There also seems to be a bearish divergence forming since the price is showing higher highs but the stochastics are sketching lower highs. If the pair slides down, the broken resistance at 1.5230 could act as support. But if it falls much further, it could find support at any of the Fibonacci levels, most likely at the 61.8% retracement level which lines up with an area of interest.
EURJPY: 4-hour
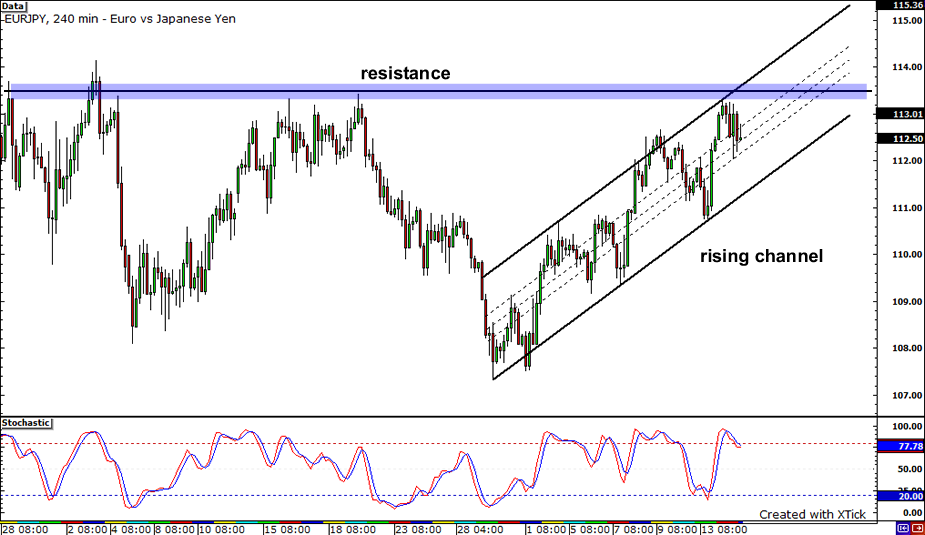
EURJPY has been moving inside a rising channel for almost a month now and it seems to have encountered a tough resistance area around 113.50 to 114.00. The pair was unable to bust through the top of the channel and appears to be aiming for the bottom of the channel again. Also, the stochastics are crawling lower, suggesting that downward price action could continue. The bottom of the channel could act as support for the pair once again and possibly push it back up to the resistance at 114.00.
USDCAD: 4-hour
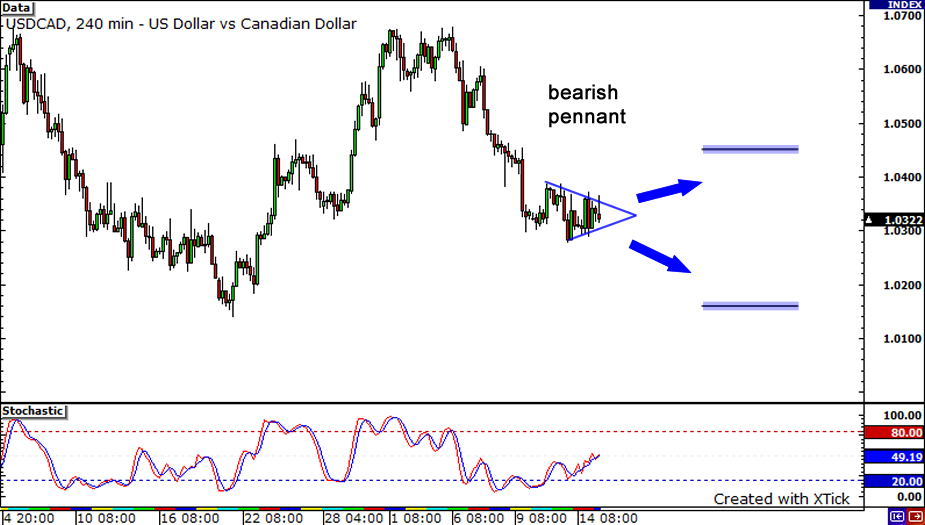
Lastly, let’s hop on over to USDCAD. The pair seems to have formed a bearish pennant, as it has consolidated after dropping from highs at 1.0680. If sellers bring their A game and take over, we could see the pair break and test the previous low at 1.0150. Then again, price may just break to the upside. If that happens, look for potential resistance at 1.0470, which was an area of interest in the past.


