About Pippin Ain't Easy

Pippin Ain't Easy Author

Like the title of this blog suggests, making pips in the Forex is easier said than done. This "reality blog" will allow you to follow my life as a Forex trader. I'll not only discuss trades, but also my emotions during these trades. You'll see my ups and downs, my highs and lows, and my smiles and tears.

This is the true story of one man, picked to live in front of his computer screen and find ways to make money off the Foreign Exchange. See what happens when markets stop being polite, and start being real!

Latest Posts

June 2010

S M T W T F S
1 2 3 4 5
6 7 8 9 10 11 12
13 14 15 16 17 18 19
20 21 22 23 24 25 26
27 28 29 30

Archives

Daily Chart Art - June 15, 2010

USDCAD: 4-hour

PoD Chart

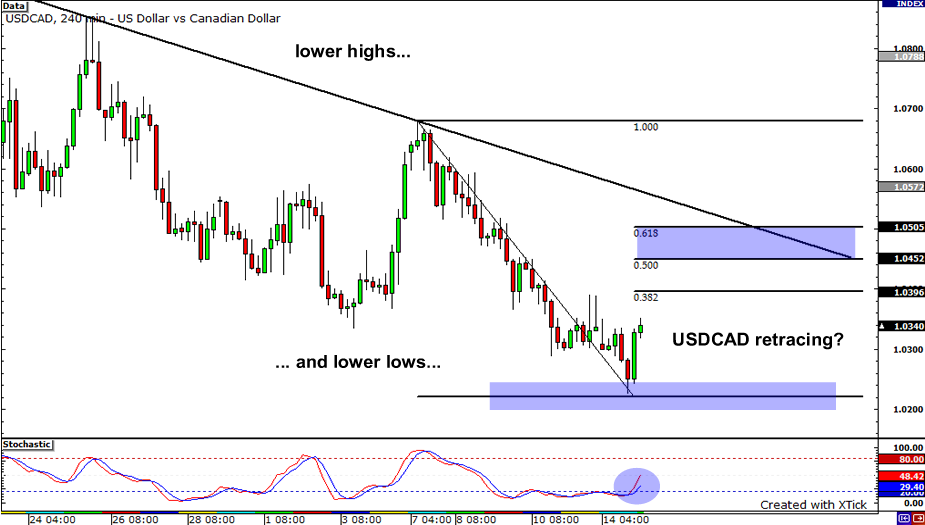
It looks like the USDCAD latest down move is finally exhausted! As you can see from the 4-hour chart I posted above, a bullish engulfing candlestick has popped up above the 1.0200 handle after the pair made a new lower low. Could this be an early signal of a push higher? If the pair does climb, it could face a lot of resistance at the 1.0500 handle, as this price level coincides nicely with the falling trend line and the 61.8% Fibonacci retracement level.

GBPUSD: Daily

PoD Chart

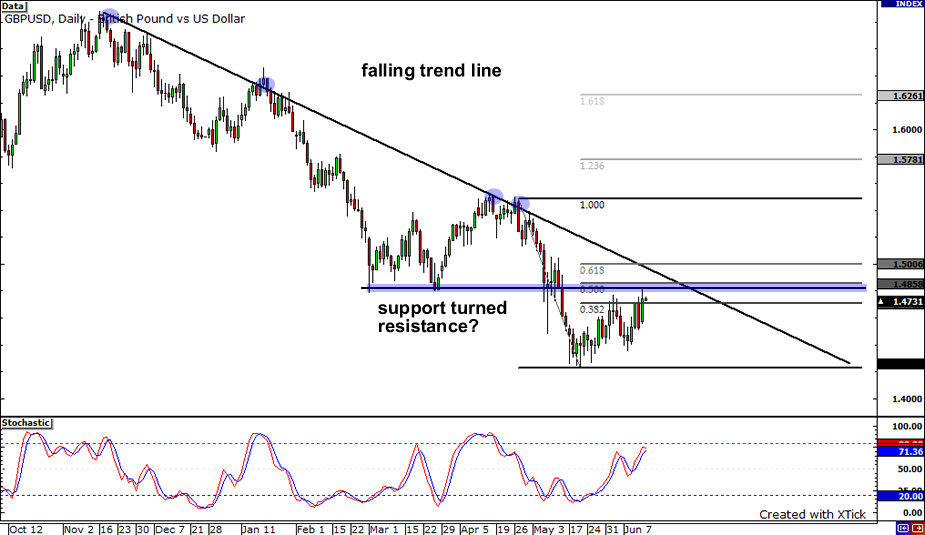
Is the cable ready to retrace? After dipping to a low of 1.4230 last month, pound sellers seem to have lost momentum, allowing the cable to climb higher. In fact, it has been edging closer and closer to that falling trend line connecting the highs of the price. Drawing some Fibs using the latest downswing revealed that the 50% retracement level is nearly in line with a broken support level around the psychological 1.4800 handle. Would this level act as resistance and send the pair back to last month's lows?

AUDUSD: Daily

PoD Chart

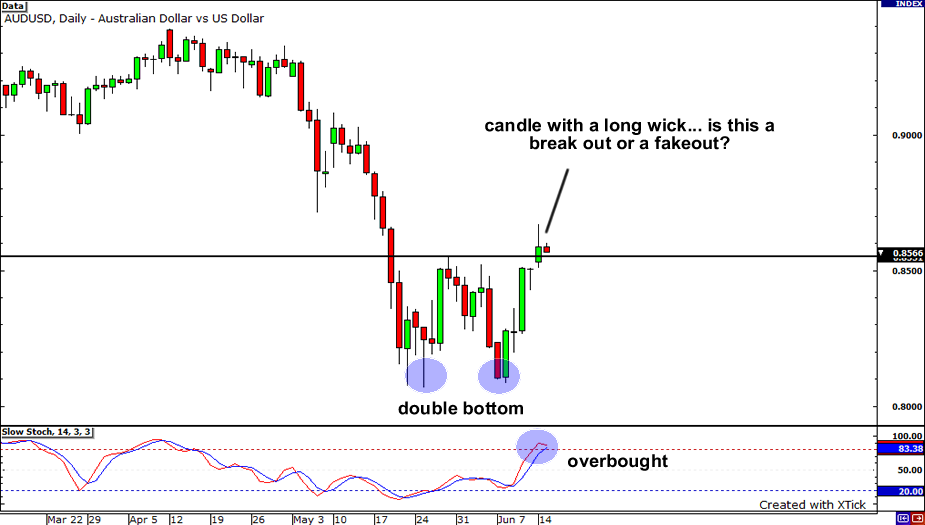
Is that a breakout of the double bottom chart pattern I see on the AUDUSD? Hmm, I'm not too sure, as the breakout candle does not seem to convincing. The upper wick of the candle is pretty long, which signifies that the pair found a lot of sellers towards the end of the trading session. With stochastics showing overbought conditions, could traders just be fading the move up? If we see price head back below .8550, it could mean that the sellers have succeeded and move upwards was just a merely a fakeout!

  • Currently 4.9/5
  • 1
  • 2
  • 3
  • 4
  • 5
Rating: 4.9/5 (13 votes cast)

blog comments powered by Disqus

Archived Comments (1)

I am impressed!!! Let watch the outcome and kidnap some pips. See u there....

"If anything is worth trying at all, it's worth trying at least 10 times."
Art Linkletter
Clicky Web Analytics
windows xp professional sp3 adobe creative suite 4 master collection mac adobe creative suite 5 production premium autodesk autocad 2012 mac office 2010 home and student photoshop lightroom 3 (64-bit) Maxon Cinema 4D R11 Studio Bundle MAC adobe fireworks cs4 office 2007 home and student RosettaStone Russian Level 1, 2 & 3 Set MAC elearning suite 2 adobe cs5.5 design standard Delicious Library 2 MAC Avanquest Fix-It Utilities Professional 9 Thegrideon Access Password Professional 2.0 adobe robohelp server 9 Acala DVD Audio Ripper