


EURUSD: Daily
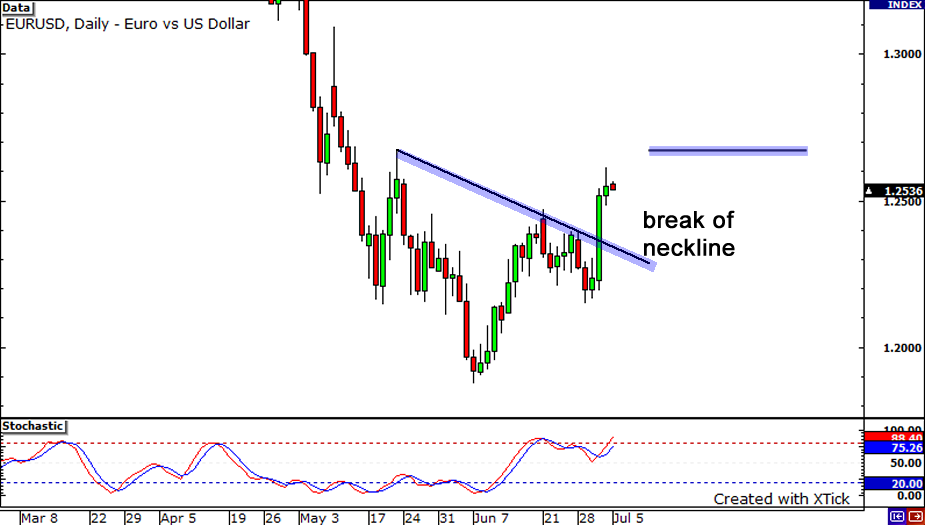
Just like that, EURUSD has broken the neckline of the inverse head and shoulders! Is this a sign of a strong up move in the making? After all, an inverse head and shoulders formation is a strong reversal pattern! Keep an eye out for the 1.2675 level – if we see a daily candle close above that level, it could signal that price will head up to test a former high just below the 1.3100 handle.
EURJPY: 4-hour
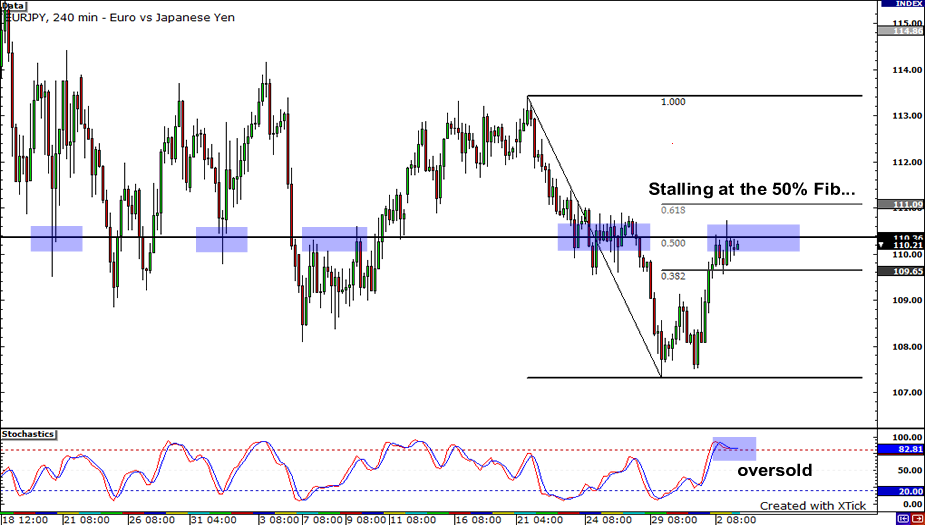
Well, well, what do we have here? EURJPY seems to be stallin’ quite nicely on the 50% Fibonacci retracement level. With stochastics showing conditions are overbought, could we see the pair swing lower? Remember, the pair is on a downtrend, as price is making “lower highs” and “lower lows.” If this resistance/area of interest holds, a move towards this former lows around the 107.50 region would be likely. Conversely, if you think the pair will head higher, look for a convincing candle close above the 61.8% Fibonacci retracement level (110.00) for confirmation.
EURGBP: 4-hour
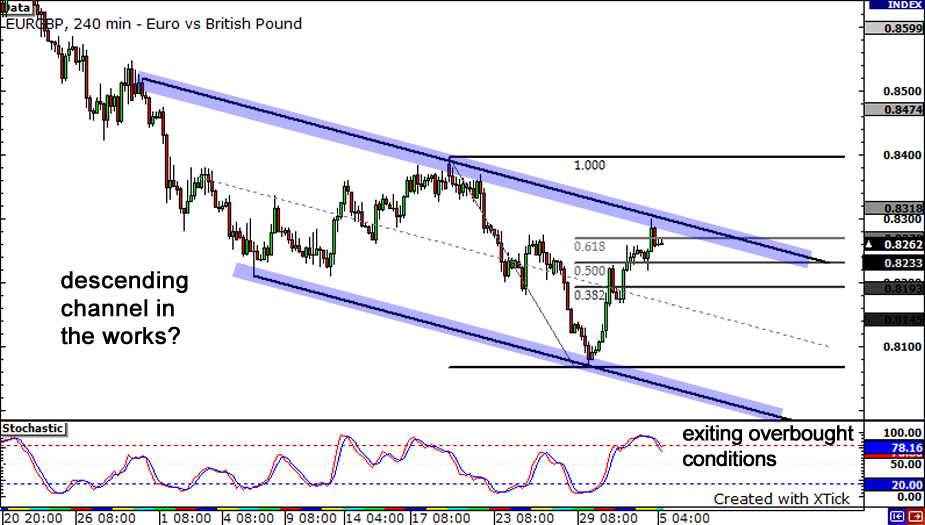
And to end our euro special, let’s head on over to EURGBP. The pair appears to be forming a descending channel right now. With stochastics just exiting overbought conditions and the 61.8% Fibonacci retracement holding, we could see sellers jump back in. Look for them to bring price back down before finding support at the middle of the channel at .8150. On the other hand, if we see a candle close above falling resistance line, we could see buyers bring up price to test highs at .8370.


