


AUDUSD: 4-hour
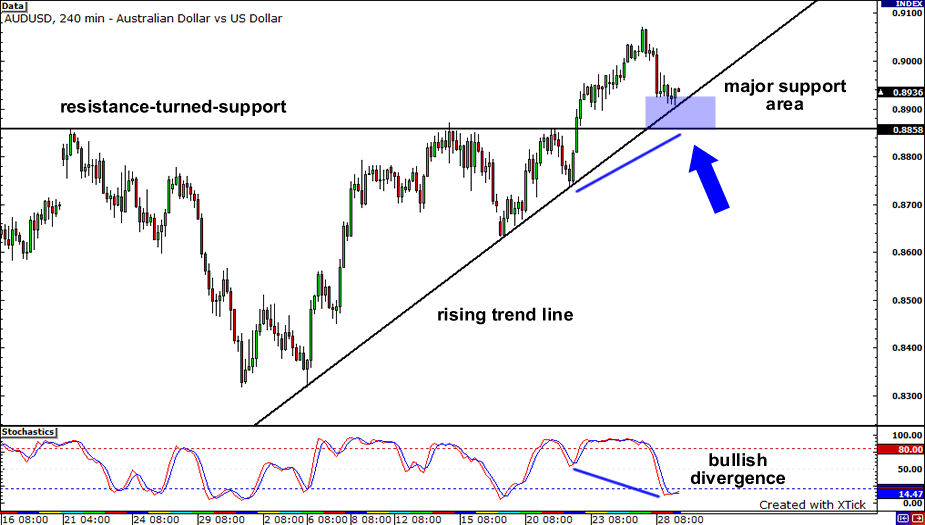
Holy momma, those are a lot of sell signals on AUDUSD! Lemme point ’em out one by one… Firstly, the rising trend line seems to be holding as price is unable to close below it. Secondly, there is very strong support at .8870, a resistance-turned-support level. And finally, there is a very clear bullish divergence as indicated by the “higher highs” in price and “lower highs” in stochastics. Hmm, a chance for the bulls to buy AUDUSD at a cheaper price?
NZDUSD: Daily

Next up, lets take a look at the Kiwi. NZDUSD seems to be consolidating into a rising wedge. Notice the shooting star candlestick formation that formed after touching resistance. Also, I see that bearish divergence seems to be forming, as price has registered higher highs but stochatsics show lower highs. With the past couple of days showing bearish candles, we could see the recent down move continue. Look for support at .7150, which served as strong resistance in the past.
USDCAD: Daily

Lastly, let’s end with my take on USDCAD. Over the past couple of months, the pair has been forming lower highs and higher lows. It looks like a symmetrical triangle to me! With stochastics just crossing over, we could see the pair rise up before finding resistance around 1.0500. On the other hand, if we see a solid bearish candle close below this week’s lows, it could be a signal that the triangle is breaking.


