


EURJPY: 4-hour

The EURJPY continued its way up yesterday (give or take a few retracements here and there) as buyers continue push price towards the 137.00 price area. Question is would this key technical and psychological resistance level be the last stop for the pair before heading down? Given the uptrend line support, it looks like the pair is poised for even more gains. If the line holds, the pair could resume its upward movement after hitting trendline support around the 135.00 region. On the flip side, if sellers come back in full force and break support, 134.00 could serve as potential support.
AUDUSD: 1-hour

Very subtly, the AUDUSD pair has just rolled into another ascending channel, after it appeared to be consolidating last week. Yes the pair is trading within a tight range, but it has registered higher highs and higher lows to form a new channel. The pair also almost hit a new yearly high, hitting .8260. It may be only a matter of time before the pair breaks the yearly high at .8264. If it fails to do so, we could see some support at .8200, as the pair could not break past it convincingly yesterday. There could also be further support at .8100, but if price hits this point, it may be a signal that the pair is breaking to the downside as it would have broken out of the ascending channel.
GBPUSD: Daily
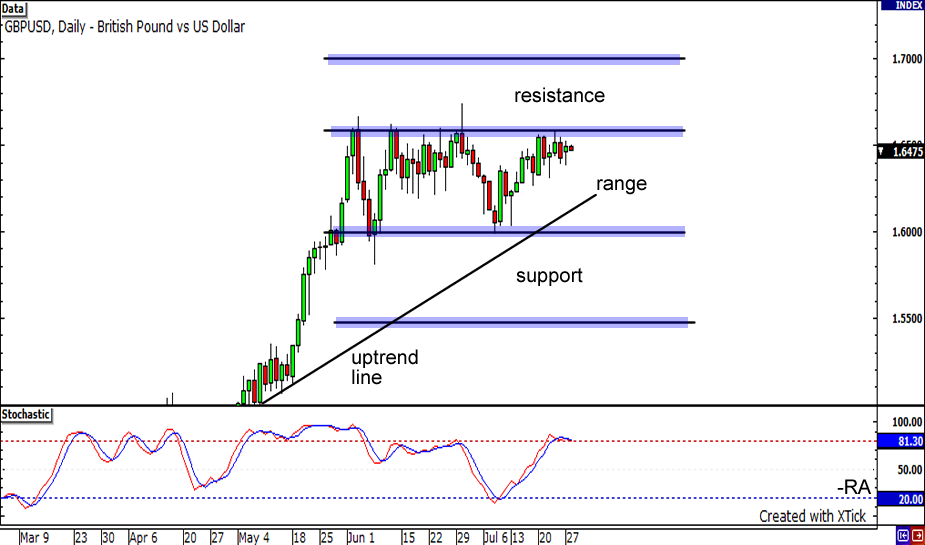
The GBP/USD pair rose by about 600 pips in the past couple of weeks. However, looking at a higher time frame, it seems like the pair has been consolidating within 1.6600 and 1.6000 for about two months now after rising by an unprecedented 2,800+ pips since March 11, 2009. Note that the uptrend since the bottom made last March 11 remains to be unbroken. Given this, the pair has more upside bias. Moreover, the pair has been ‘knocking’ and ‘softening’ the range’s resistance more than it has been on its support. Further risk appetite, in my opinion, would push the price above 1.6600. The next target for the pair if it does would be 1.7000. On the flip side, the pair may fall all the way to 1.5500 if it loses its steam and manages to break below the uptrend line and the range’s support at 1.6000.


