


GBPUSD
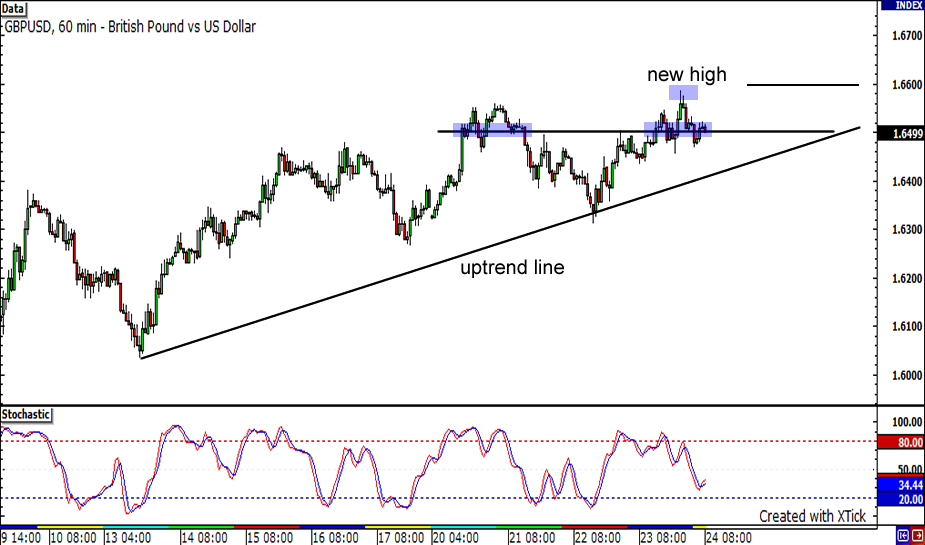
A 60-minute chart of GBP/USD is shown above. The pair is on a hot streak as it continues to move higher and higher. It even made a new monthly high in yesterday’s trading. Currently, the price is ‘resting’ at the psychological 1.6500 mark. This support level could serve as a springboard for the pair. The next significant resistance would be 1.6600. On the other hand, if the 1.6500 gets broken down then the next support for the pair would be the uptrend line.
USDJPY

Look at the USD/JPY jumping to get back in the range! This pair previously breached the strong support level around 94.30 and dived to a low of 91.74 just last week. The 94.30 mark seems to have turned into a resistance level as the pair had difficulty rising above this area a few days ago. Yesterday, we saw a long green candle pierce through the resistance, bringing the pair back in its comfort zone. Could we chalk that up as a false break or is the pair simply gasping for air before diving deep down again? The stochastic is still climbing, which means that the pair stands to make further headway upwards. The 94.30 handle could resume its role as support level. Possible resistance points are found at psychologically significant levels such as 95.00 and 96.00. If the pair dives back under 94.30, then support could be found at the previous low of 91.74.
EURJPY
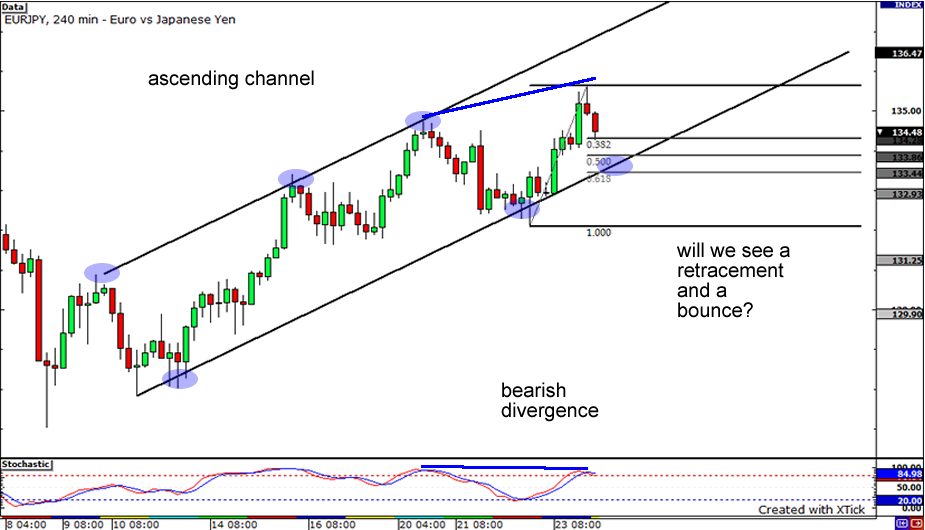
Will you look at that? It seems that the broken uptrend line that I pointed out last week isn’t merely a trend line – the pair seems to be in an ascending channel now! After testing the bottom of the channel, the pair shot off and broke the most recent high. The pair seems destined for a pull back as price is retracing right now. Take note that there appears to be some bearish divergence forming, as price is registered higher highs while the oscillator is showing lower highs. If the pair continues to retrace, we could see some support at the bottom of the channel, which lines up closely with the .618 Fibonacci retracement level.


