


USDJPY: 4-hour
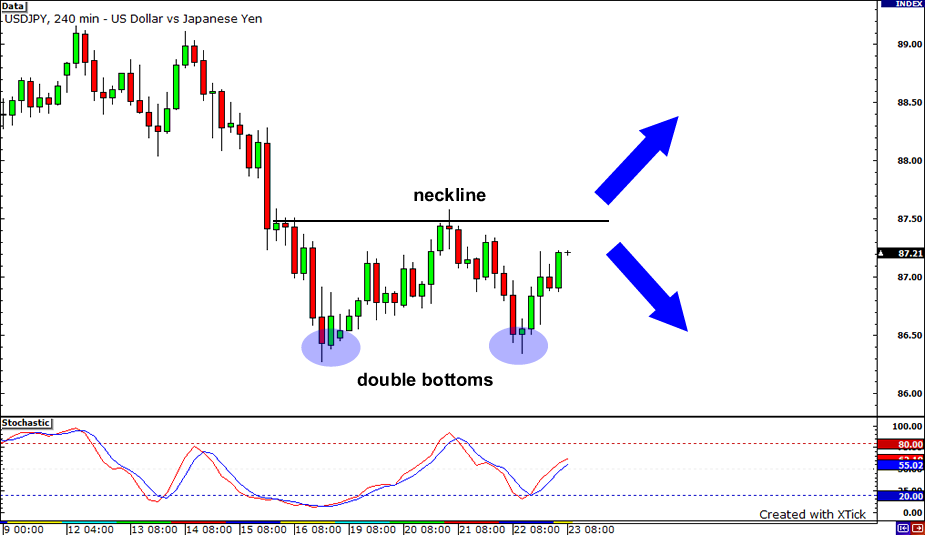
Aha! Look at those double bottoms on USDJPY’s 4-hour chart. I sense a brewing reversal from the pair’s downtrend… But before that happens, the pair has yet to break above the neckline of the formation. A candle that closes significantly above the 87.50 mark could serve as additional confirmation that an uptrend is about to start. However, if USDJPY is unable to bust above the neckline, it could fall back and create another bottom around 86.35.
USDCHF: 1-hour
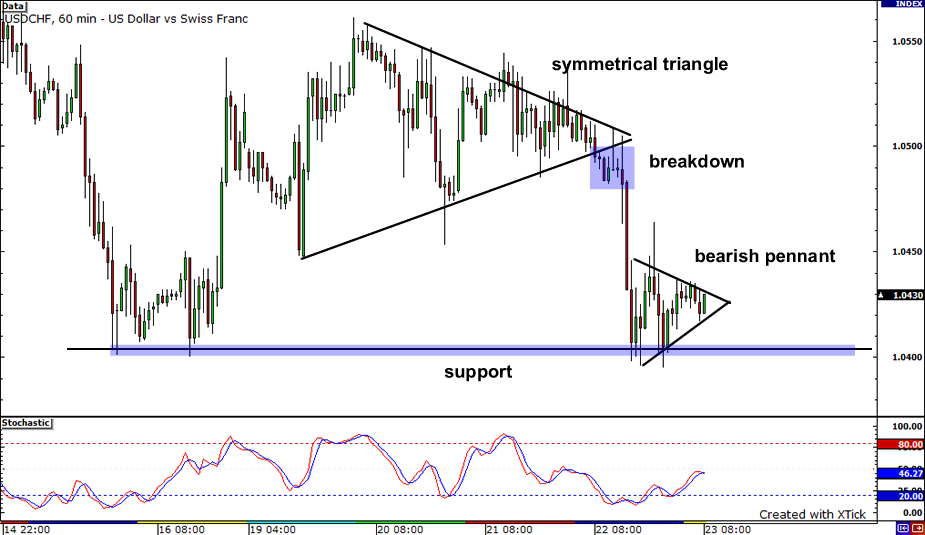
Check out the exciting action on USDCHF’s 1-hour chart! After making a strong breakdown from the symmetrical triangle formation, the pair went on to test the strong support level near 1.0400. But then sellers seemed to run out of steam as the pair simply consolidated in that area. Could it be gearing up for another strong move down? Judging from that bearish pennant formation, it does look like it!
CADJPY: Daily
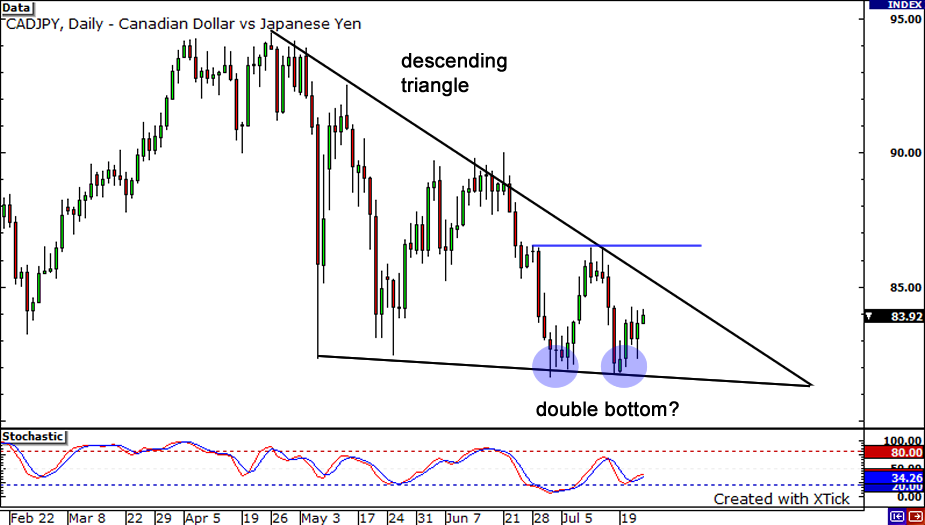
It looks like a double bottom is also forming on CADJPY! Be careful though, as this pair has also formed a descending triangle. It’s still a long way off, but if we see price close above the neckline at 86.30, it may be a sign that the recent sign that the downtrend has come to an end and that the pair will shoot for the skies! On the other hand, if we see a daily candle close below key support at 82.00, the pair could go into a freefall, as there’s no clear support levels in sight!


