


USDCAD: Daily
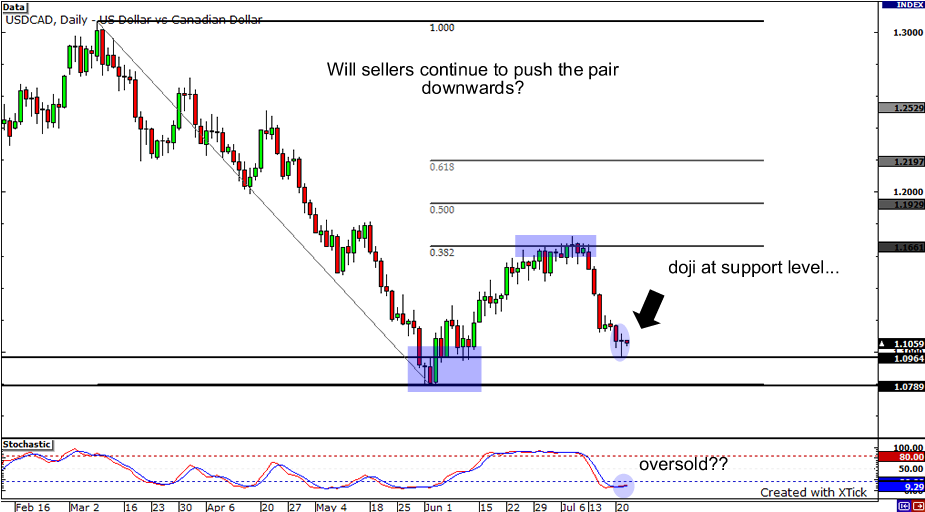
Something interesting is happening at the USDCAD daily chart. Check out that doji candle that tried to pierce 1.0950 yesterday, a major support level! Usually, doji candles are associated with direction reversals. This, taken together with stochastic indicating that the pair might be oversold, signifies a possible bounce back up. If this is the case, its next potential resistance would be at 1.1130 and 1.1200 respectively. Of course, this is the FX market and we can never know for certain. So on the flip side, sellers could take very well break through 1.0900 and take the pair down to yearly lows around the 1.0790 area.
EURJPY: 1-hour
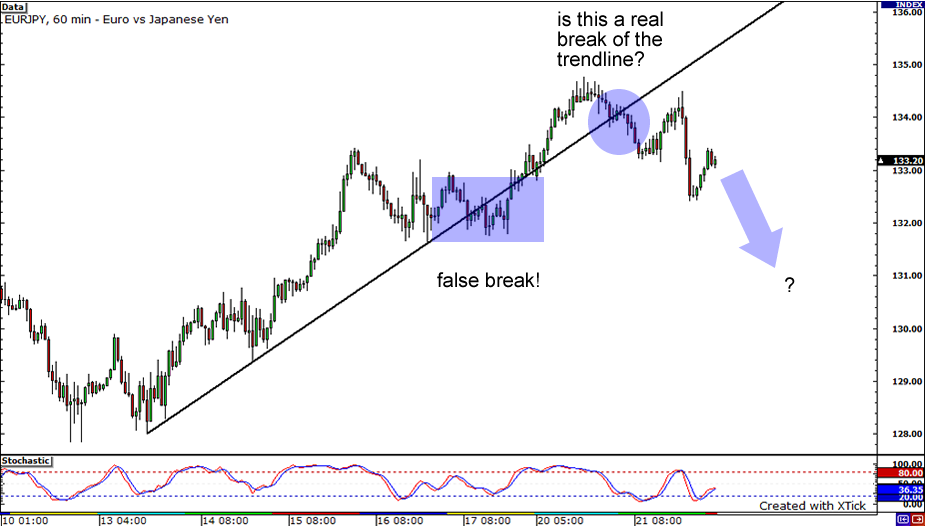
For the past week and change, we’ve seen the EURJPY follow a strong uptrend line. I had pointed out how there appeared to be a false break last week, before the pair continued to rise and follow the trendline once again. Early in the trading yesterday however, it appears that the pair subtly broke to the downside. We see that yen made a good strong push during intraday trading as price action registered a lower high. The pair ultimately closed significantly lower. Is it time to signal the alarm and say that the pair has officially broke out? Or is it merely a retracement and will the pair jump back into the uptrend?
NZDUSD: 1-hour
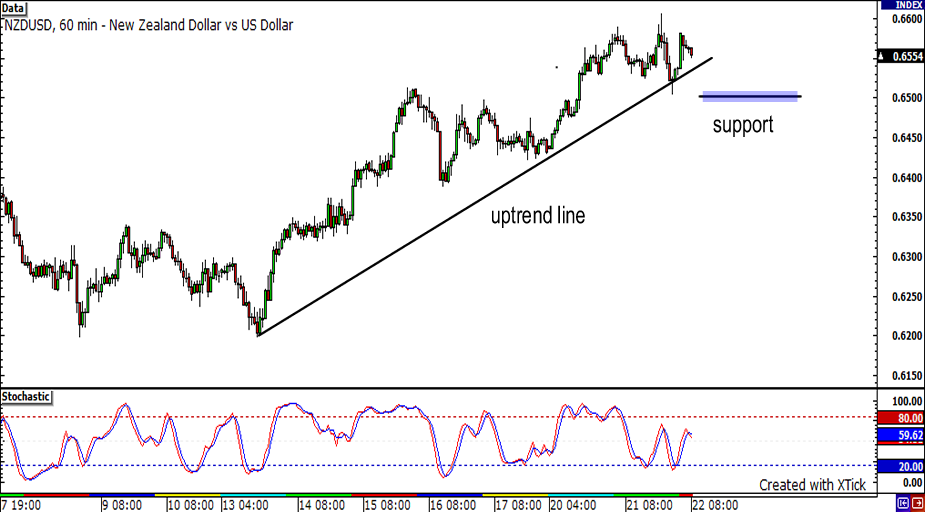
A 60-minute chart of NZD/USD is shown above. As you can see from the pair’s chart, the pair has been on an uptrend since July 13, 2009. The price has an inclination to move higher since the pair’s uptrend remains to be intact. It would continue to do so until it breaks the support. 0.6600 is an easy target to hit if risk appetite goes on. On the other hand, if the pair closes below the support then it can move lower until it finds some support at the psychological 0.6500 level.


