


USDJPY
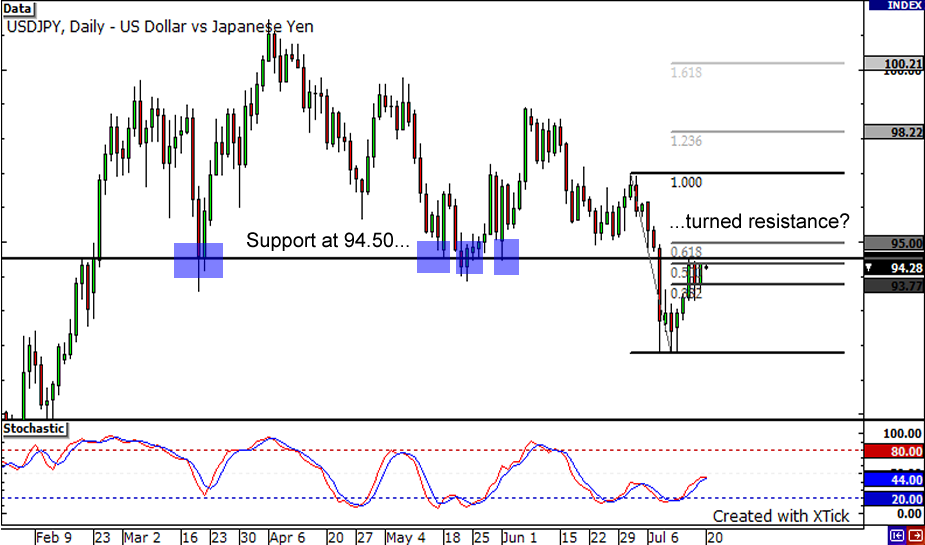
Is the USD/JPY coming close to hitting the ceiling? We have seen previous support at 94.50, which the pair drilled through a couple of weeks ago. The pair found itself falling down to the 92.00 region afterwards. Last week, the pair jumped back on its feet and started to make its way up. It is currently nearing the 94.50 mark, which could be a potential resistance level. This coincides with the 50% Fibonacci retracement level, which the pair could touch before tumbling down again. Another possible resistance level is at the 95.00 mark, which lines up nicely with the 61.8% Fibonacci retracement level. If the pair takes a rally beyond these areas, the pair could be back to its usual range, with support at 94.50.
NZDUSD
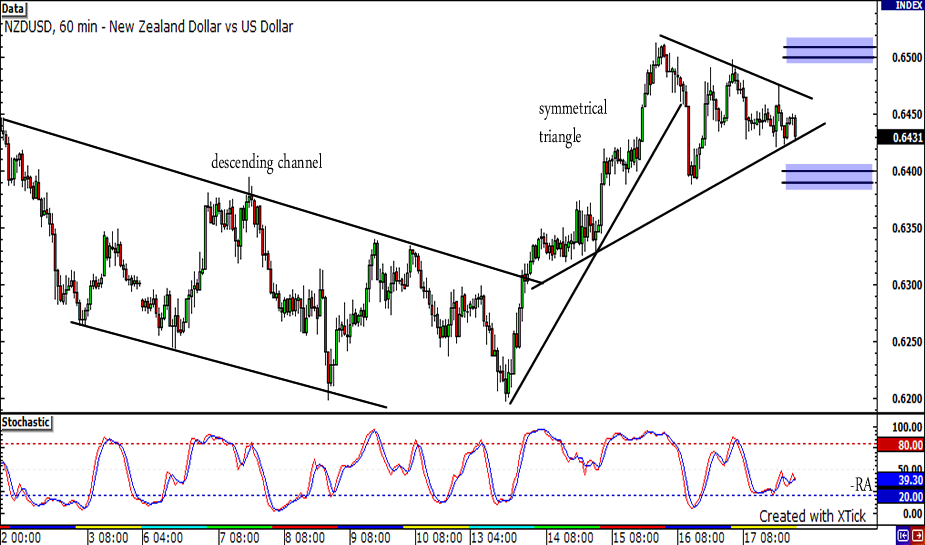
It was a wild ride for the NZD/USD pair as you can see from its 60-minute chart above. The pair moved within a 150-pip wide descending channel from July 2 to July 13. It then made a 3-day sharp rise to break free from the mentioned channel. However, after shooting up by about 300 pips the pair now looks to be losing its steam as it is starting to consolidate once again into a symmetrical triangle formation. A break out/down is imminent here in my opinion. If the pair manages to breakout then it can easily reach 0.6500 or the previous week’s high. On the other hand, the price may head lower until it finds some support at 0.6400 if the it breaks down from the formation.
EURJPY
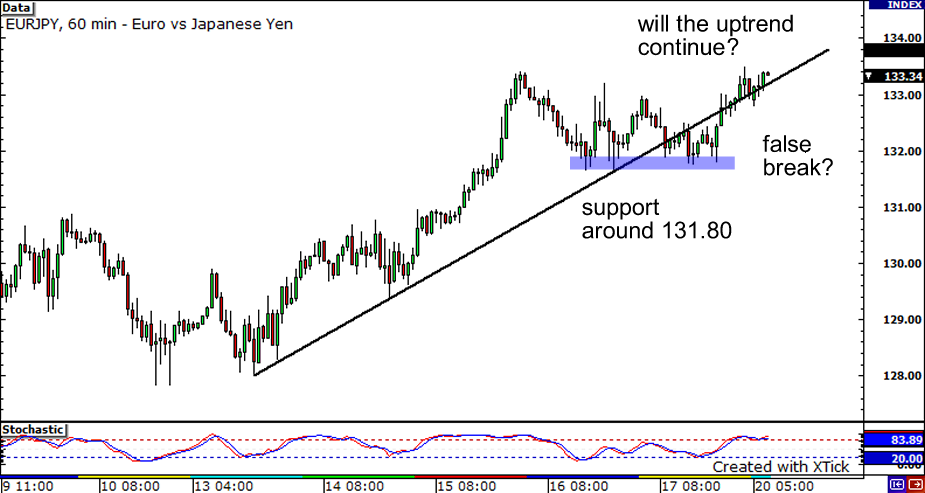
It appeared that the EURJPY pair was headed for a breakout to the downside after the euro made a strong rally during the week. It seemed just about time, as the pair had tested the trendline repeatedly in the past. Alas, it turned out to be a false break! There seems to be support around the 131.80 area, as price could not break past and could not even reach the previous day’s low. The pair bounced off the support and rose, and went back above the trend line. Will we see the pair continue to rise? Or will we see price action test the uptrend line once again?


