


EURUSD: 1-hour
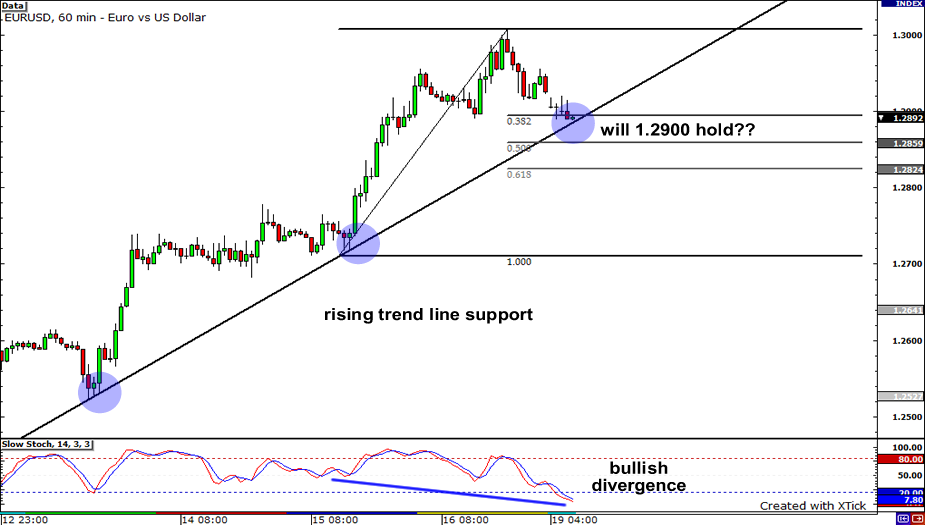
Will the rising trend line support hold or not? For now, price seems to favor an upside bounce as price seems to be holding steady at the 1.2900 psychological barrier. This price level also lines up with three important technical levels: the .382 FIbonacci retracement level, Friday’s low, and a rising trend line. And finally, a bullish divergence has formed, which strengthens the argument for a move higher. If we do see price rally, a move towards 1.3000 will be likely. On the other hand, if price falls, the next support level for the pair would be at 1.2800.
GBPUSD: 4-hour
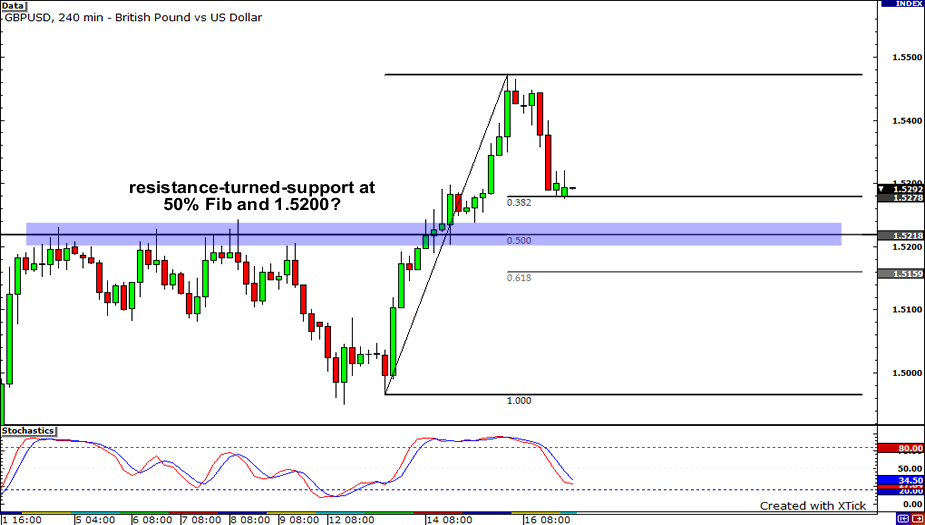
Looks like GBPUSD has retraced some of its gains. It’s too early to call this a reversal, so the overall technical bias is still bullish. As you can see, the pair could find strong support around the 1.5200 region because that level served as an important resistance level in the past. One thing you should remember about broken resistance levels is that they become support whenever price passes through them. Moreover, this resistance-turned-support level coincides nicely with the .500 Fibonacci retracement level. With stochastics approaching oversold conditions, we could see GBPUSD popup a bit after it hits 1.5200.
USDCHF: 1-hour
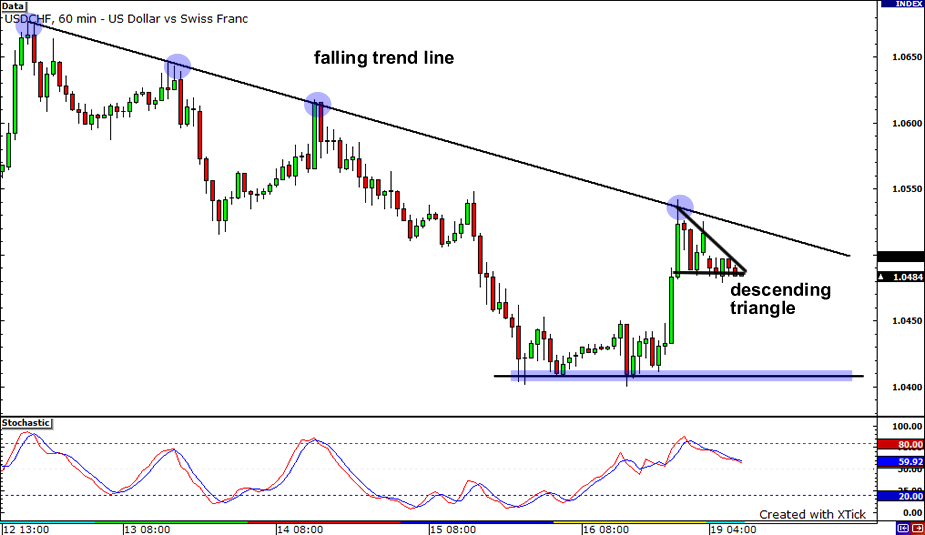
Will USDCHF keep moving down? There’s a descending trend line connecting the highs of the price on the 1-hour chart, keeping the pair on a steady downtrend. After hitting that trend line, the pair seems to have formed a descending triangle formation. If it breaks to the bottom of the triangle, the pair could fall all the way down and find a floor near the psychological 1.0400 handle. But if it breaks to the topside, it could bust above the falling trend line and rally up to last week’s high of 1.0677.


