


USDCAD: 1-Hour

Is that a bullish flag I see on the USDCAD 1-hour chart? After making a strong almost-vertical upsurge, the pair consolidated for a bit, right between 1.0530 and 1.0580. It is currently sitting at the bottom of the 50-pip range, possibly waiting for further buying pressure to push it higher. If the buyers carry the pair above the minor resistance at 1.0580, it could proceed to retest the previous day high near the psychological resistance at 1.0600. On the other hand, if the pair breaks below the 1.0530 level, it could find support at the previous day low of 1.0512, which lines up with the 38.2% Fibonacci retracement level.
GBPJPY: Daily

Do you remember that descending triangle on the GBPJPY 1-hour chart that I showed you the other day? Well, here’s a large-scale version of that one on the daily chart! A descending trend line can be drawn connecting the highs of the pair since August 2009 and, at the same time, the pair has been seeking support right around the 139.00 area. Presently, the pair is trying to break below the long-term support at the psychological 139.00 handle. If it is able to do so, it could breach one psychological support level at a time before plummeting all the way down to the previous year low of 118.83. But if the buyers take control of the action, the pair could bounce from the 139.00 level and climb to retest the falling trend line.
AUDJPY: 4-Hour
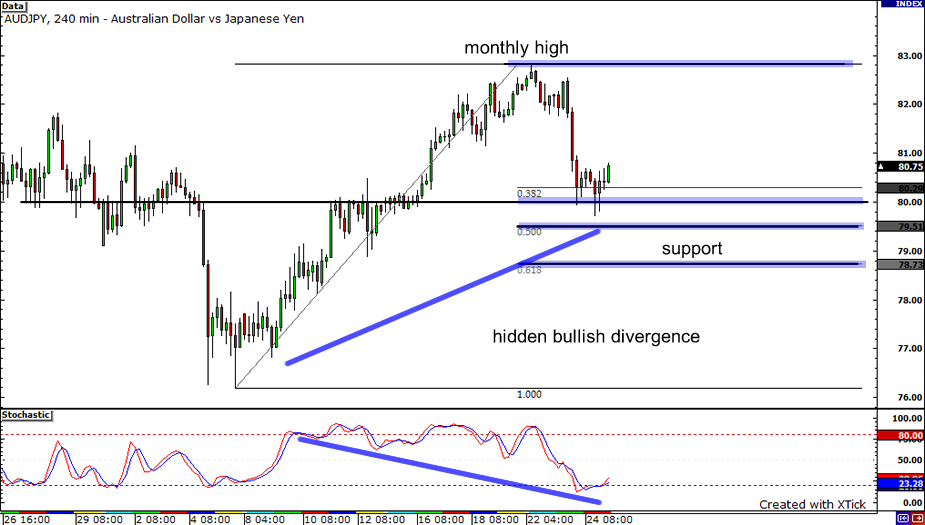
Next is the AUDJPY on its 4-hour chart. Notice how the 38.2% Fibonacci retracement level and the 80.00 psychological handle acted as nets to keep the pair afloat. A hidden bullish divergence is also in play, suggesting that the pair can indeed trek higher soon. If it does, then it’s possible for it to reach its monthly high. But if risk aversion surfaces again and the pair falls below the 80.00 handle, we could see it back to its 50% or even down its 61.8% Fib.


