


GBPUSD: 4-Hour
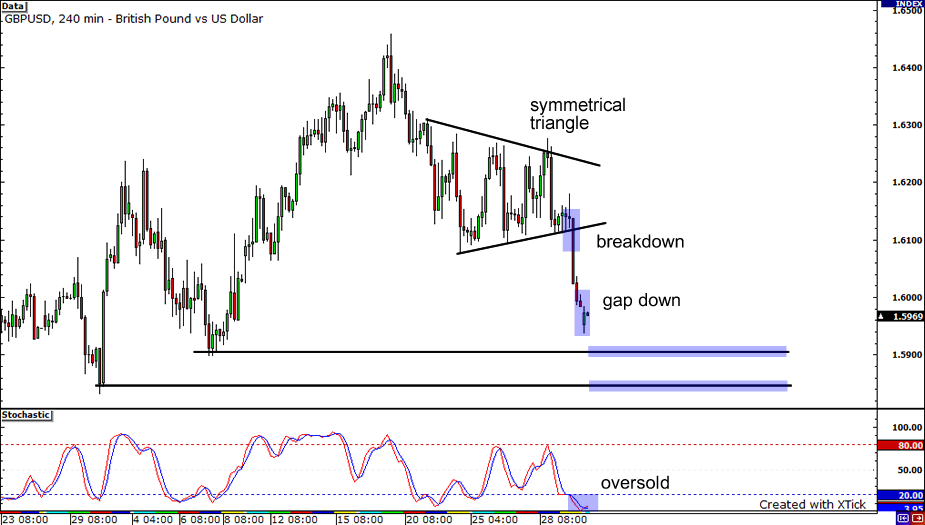
The pound bears are having a feast nowadays as the GBPUSD slid lower when it broke down from a symmetrical triangle pattern. It looks like Lady Luck is once again on their side with the Cable gapping down during the opening of today’s session. The pair, however, could trade below the 1.6000 handle for awhile before heading lower since the stochastics are already in the oversold region. It is likely to fall further since there is no apparent reversal signal yet. If it does then 1.5900 and 1.5850 could be its next downside targets.
EURUSD: Daily
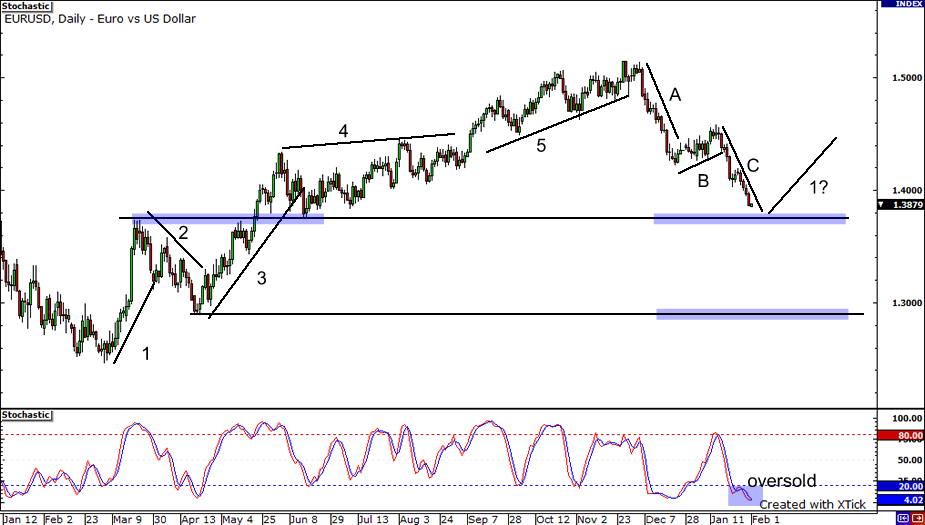
Next is the EURUSD on its daily chart. Using Elliot wave analysis, the pair could be presently at the tail end of the C wave already. Since there is no apparent swing low yet, Wave C can still extend further down until it find some support somewhere between 1.3800 and 1.3700. With the stochastics in the oversold area, it is likely for the pair to turn up soon, perhaps forming another Wave 1. But if the area of support that I mentioned earlier gives way, the pair could fall all the way down at the support just below 1.3000.
NZDUSD: 1-hour
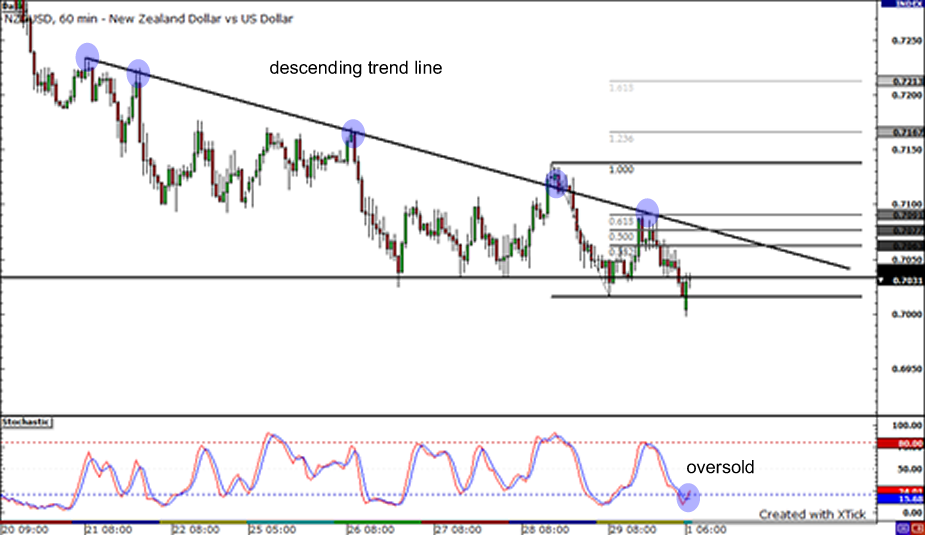
Here’s what I spotted on the NZDUSD 1-hour chart. A descending trend line can be drawn connecting the highs of the pair and it seems like the trend line has held for almost two weeks! The pair retested the trend line resistance last Friday as it bounced from support around 0.7030 and retraced until the 61.8% Fibonacci level. Right now, it looks like the pair has broken below support at 0.7030 and may proceed to move lower. However, the stochastics are climbing out of the oversold area, indicating that upward price action could take place soon. If the pair lands back above 0.7030, it could move all the way up to retest the trend line once more. On the other hand, if the broken support at 0.7030 serves as a resistance level, the pair could tumble all the way down once it breaks the psychological 0.7000 barrier.


