


AUDUSD: Daily

Ahh!! Warning guys! For those who are bullish on the AUDUSD pair… watch out! The pair has a big potential to reverse given the head and shoulders pattern that it is forming in its daily chart. The formation’s neckline is a very crucial level. If the neckline breaks then the pair can fall all the way down to 0.8500! Now, that’s about 500 pips! That’s huge! How did I arrive to 0.8500? Well, targets can be gauged by projecting the height of the pattern from the point of breakout. In any case, if buying interest persists then it’s also possible for the pair to reach its yearly high again.
AUDJPY: 4-hour
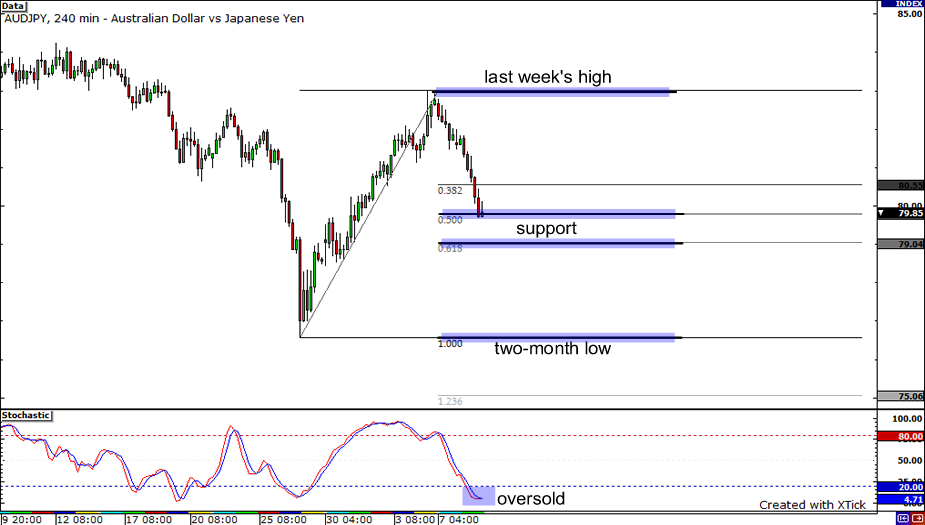
Moving on to the AUDUSD’s sister pair… the AUDJPY! As you can see from its 4-hour chart above, the AUDJPY bears have prevailed for the past couple of days. After reaching a high of 82.99 last week, the pair currently finds itself just below 80.00. Presently, it is hovering over the 50.0% Fibonacci retracement level that I drew. With the stochastics in the oversold territory, it’s probable for the pair to regain strength any time now and bounce back again. If it does then it can revisit last week’s high. Nonetheless, the next level of support would be its 61.8% Fib if the 50% Fib breaks. If these fibs get breached then the next notable support would already be at its two-month low.
USDCAD: 4-hour
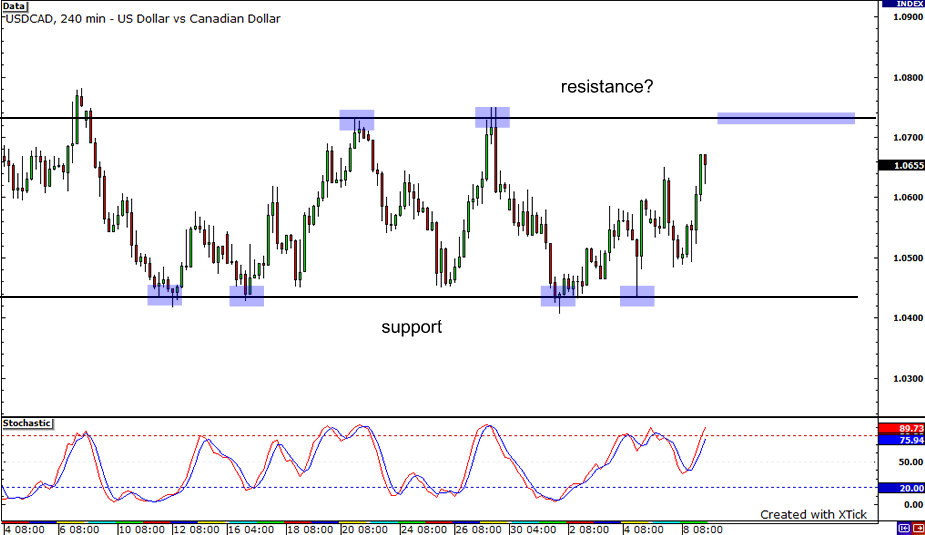
Next is the USDCAD 4-hour chart. The pair has been confined in a range for almost an entire month. It has found support at the 1.0430 level and seems to encounter resistance around 1.0730. Well, the pair has been unable to bust through that level in its past two attempts to climb higher. Right now, the pair is gunning for the 1.0730 area again, with the stochastics nearly in the overbought zone. Would the pair’s rally come to a halt after reaching 1.0730 or would it be able to break the resistance this time? If the latter takes place, the pair could tumble back down to support at 1.0430. On the other hand, if the pair surges past 1.0730, the next resistance level in sight is located near the psychological 1.0800 handle.


