


AUDUSD: 4-hour

If you’re into candlestick analysis, you’re going to love this AUDUSD update… Look at that gravestone doji just sitting there on the broken trend line support, signaling a possible move downwards. With price between the 0.500 and 0.618 Fibonacci retracement levels and stochastics showing that the pair is deeply overbought, we could see sellers start jumping in. If they do, the pair’s next likely stop is the previous swing low, somewhere around the 0.8740-0.8800 area. However, if we see a candle close above the 0.618 Fib, look for a move towards 0.9100.
EURJPY: Daily

Let’s move on to the EURJPY. After several days of gaining, it looks the pair will be met with significant resistance as it is trading at 132.00, right at the falling trend line. Couple this with stochastics at overbought territory, we could see sellers start shorting the pair again. If this happens, the pair would probably drop towards strong support at 129.00. On the other hand, if the falling trend line breaks, the pair could soar as high as 134.50 before finding any resistance.
NZDUSD: 4-hour
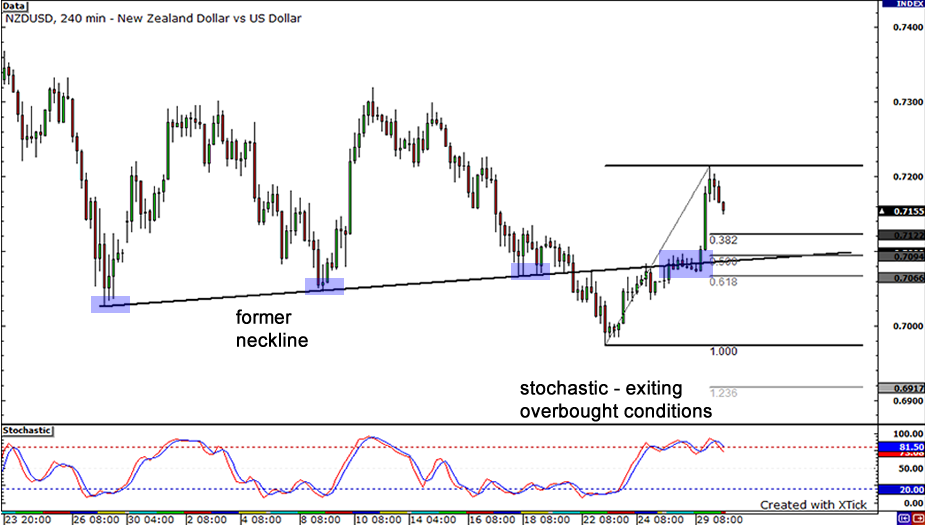
And finally, let’s end the year with one last look at the Kiwi! A couple days ago, I pointed out a former rising trendline that the pair broke through last week. Earlier this week, the former trendline served as a short term resistance… before breaking out yesterday to test the 0.7200 handle! Right now, the pair seems to be retracing a bit and with stochastic exiting overbought conditions, we could see the pair continue to dip before finding support around 0.7100. This price handle seems to be an area of interest and also happens to coincide with the .500 Fibonacci retracement level. If support fails to hold, we could see the pair free fall to test the recent swing low just below the 0.7000 price mark.On the other hand, if recent buying pressure remains strong, the pair may just jump back up and test for new highs near 0.7300.


