


USDCAD: 4-Hour

Here’s an update for the USDCAD 4-hour chart I showed you yesterday. The pair seems to be on the verge of breaking below the rising trend line, suggesting that it could edge lower. If the pair successfully breaks the trend line, it could drop all the way down and find support around the 1.0435 area. However, the stochastics are nearly in the oversold area, implying that upward price action may come soon. If the pair lands back above the ascending trend line, it could climb all the way up and encounter resistance at 1.0730.
USDJPY: Daily
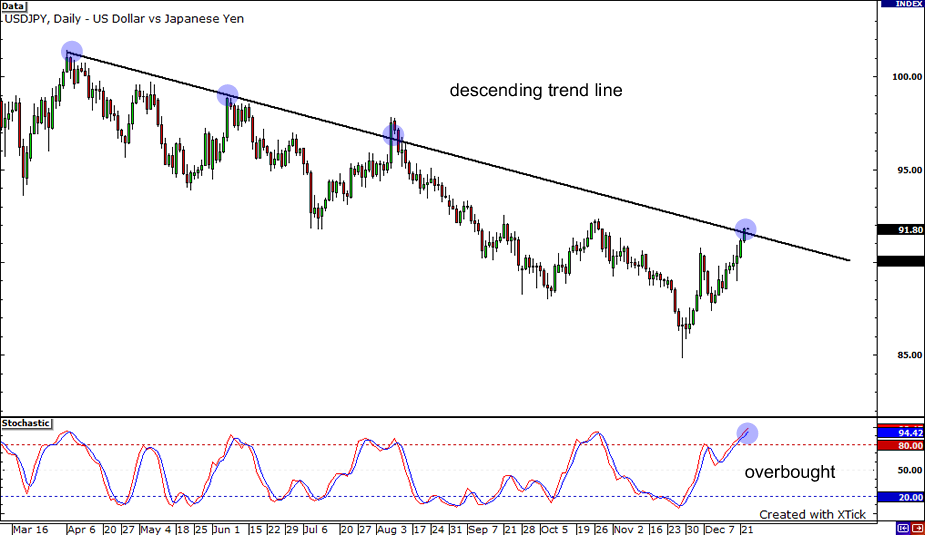
Let’s head over to the USDJPY daily chart. It looks like our safe-haven tandem is sitting right on the descending trend line. Would this trend line hold as resistance and push the pair down? The stochastics, which are in the overbought region, seem to agree. If the pair tumbles down, it could dip as low as the previous month low of 84.85, which is very close to the psychological 85.00 handle. On the other hand, if the pair breaks above the falling trend line, it could zoom all the way up to this year’s high of 101.39! Whee!
NZDUSD: Daily

Wahh! For those who are bullish on the Kiwi, watch out! The NZDUSD pair is attempting to crack the descending triangle‘s support and the psychological 0.7000 mark! If these two levels give way, then it could fall all the way down to 0.6500. Otherwise, it could continue trading within the triangle until it really breaks up or down. Should it break above the formation’s resistance, then its upside target would be this year’s high.


