


EURUSD: 4-hour

The EURUSD managed to break out slightly from its rectangular formation yesterday but the pair’s losses were limited. It seems that it is inching slowly towards the previous week’s high at 1.4300. A bullish divergence has formed as indicated by the lower highs in price and lower lows in the stochastic. In addition, the 38.2 Fibonacci level nicely coincides with last week’s high. Will the 1.4300 price region, which served as significant resistance last week, now serve as support? If this happens, the pair could bounce back topside and retest resistance at this week’s high at 1.4450. On the flip side, if the pair continues its slow descent downwards, potential support could be found at the 50% (1.4226) and 61.8% (1.4174) Fibonacci levels.
GBPUSD: 1-hour

A 60-minute chart is shown above. After playing a game of tug-of-war around the 1.7000 area, the sellers finally came through which led the GBP flat on its face. The price fell by about 200 pips within one hour. In the process, the 1.6900 to 1.7000 range was broken down. After doing so, the price initially bounced off the pair’s uptrend line but the sellers continued to dump on the GBP. The price eventually broke below the uptrend line and the psychological 1.6800 mark. This level is now acting as a resistance. The pair has a bigger chance of moving lower after hitting 1.6800 given the previous breakdowns. It can find support at 1.6700 if it does. On the other hand, the pair can move back to 1.6900 if it manages to close above 1.6800.
AUDUSD: 4-hour
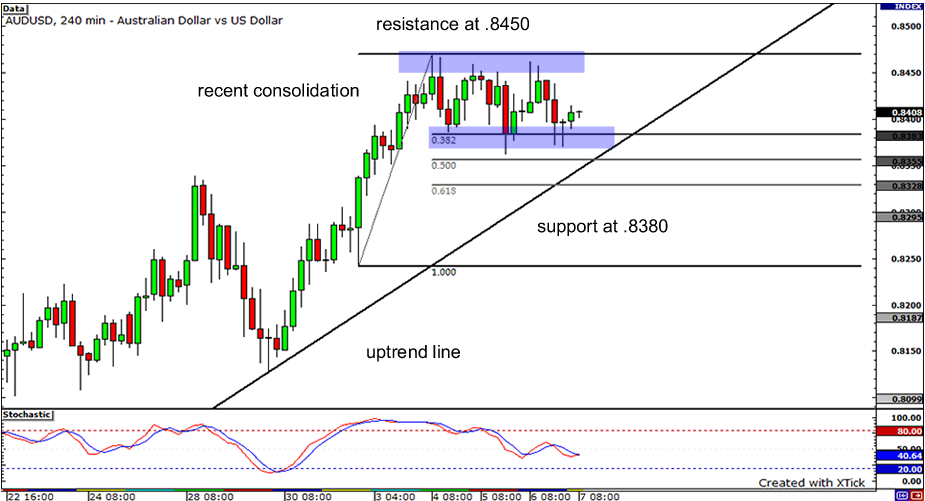
After posting 3 consecutive days of new yearly highs, the AUDUSD pair has seemed to take a break, as it has been in a consolidation period the past couple of days. It seems like buyers cant break past the .8450 as there appears to be resistance at that price level. At the same time though, sellers don’t have enough power to break past support at .8380 (which lines up nicely with the .382 Fibonacci retracement level). Price action is now approaching the recent uptrend line – is the recent consolidation a signal for a breakout? If price action breaks through the support of the uptrend line and .8380 price level, we could see price continue to move down until about .8250, where there was some support previously. If it breaks to the topside and breaks the resistance, it will most likely establish new yearly high.


