


EURUSD: 4-hour
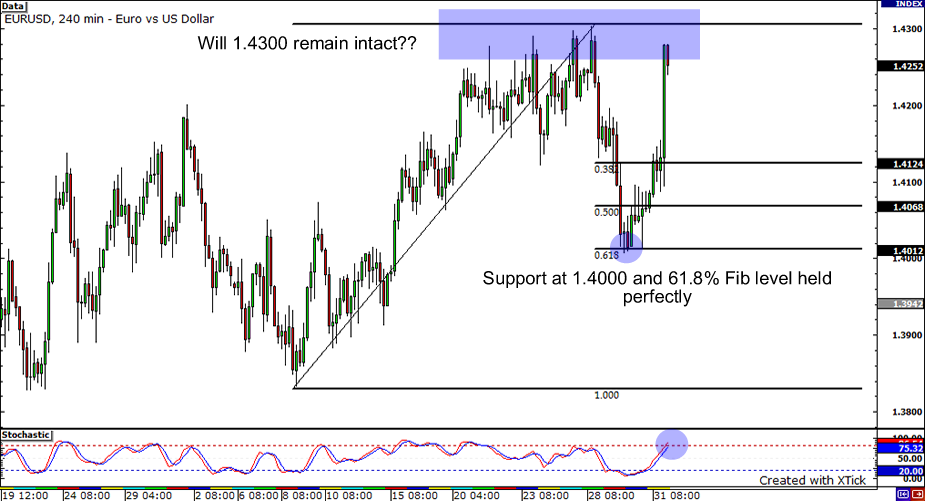
Wow, look at that… the EURUSD made a convincing rally at the end of last week! From the four-hour chart we can see that support at the psychological price level at 1.4000, which coincides nicely with the 61.8% Fibonacci level, was tested but held perfectly. It is now approaching 1.4300, a key resistance level. This price level has served as a solid range boundary the past few weeks so we might see price consolidate a bit in that price region before finally choosing its direction. If the pair breaks out topside, 1.4400 and 1.4700 would probably prove to be significant resistance levels. On the other hand, if 1.4300 remains intact and the pair heads south, its next stop would be 1.4150 and 1.4000 respectively.
GBPUSD: 1-hour

Above is an update on GBP/USD’s price movement. After hitting a wall at 1.6500, the pair managed to close above it and rise up to the range’s resistance. The pair, however, was sold down back at the 1.6500 mark after rising towards 1.6550. The 1.6500 level acted as a spring board and propelled the pair above the resistance afterward. The pair managed to support its upward momentum as it easily broke through the 1.6600 and 1.6650 levels. The price is currently stalling at 1.6700. It may use this level as a springboard once again. Risk appetite may sustain such action given the overall sentiment for risk appetite. It can easily reach 1.6750 if it does. On the other hand, the pair can move lower to 1.6650 if the sellers decide to cash in some profits.
AUDUSD: Daily
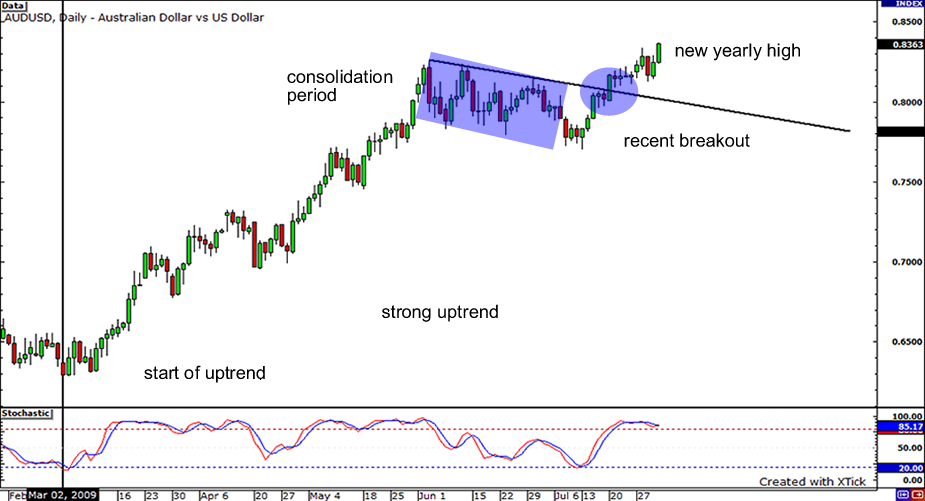
Happy New Yearly High! It’s the middle of summer but there have been a lot of fireworks with the AUDUSD pair, as it has set a new yearly high. The pair had been in a consolidation period for much of May and June before breaking out, only to begin trading in a tight range between .8100 and .8200 for a couple of weeks. Now, the pair has broken out and seems like it may continue to zoom away. It may encounter some psychological resistance at .8500. If a pullback is in play, we may see some support at .8100, a previous strong support area, or further down at .8000 where it may line up with the previous downtrend resistance from the downtrending consolidation area.


