


AUDUSD: 4-hour
The AUDUSD made another “shoot down” (as I like to call it), as the pair zoomed down before stopping at support from the uptrend line.
The pair has done this in the past, only to break back up to the top as the uptrend line has been providing stable support. This time, however, there appears to be some consolidation.
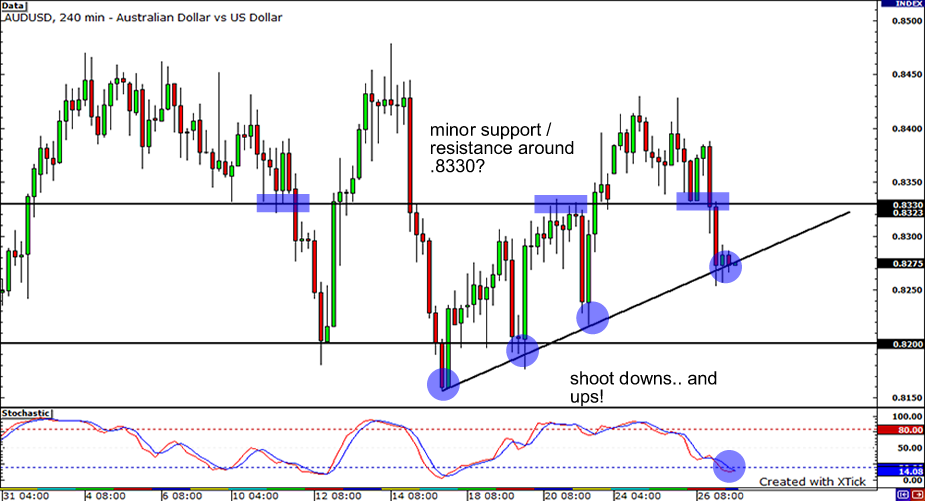
Could we be in line for a breakout to the downside? Stochastic suggests that sellers might be overdone. If the pair does break the up trend line, it may find support at previous lows just above .8200.
If uptrend support holds however and the price bounces back up, it may find some minor resistance around .8330 before it seems some smooth sailing to test highs above .8400.
USDCHF: 1-hour
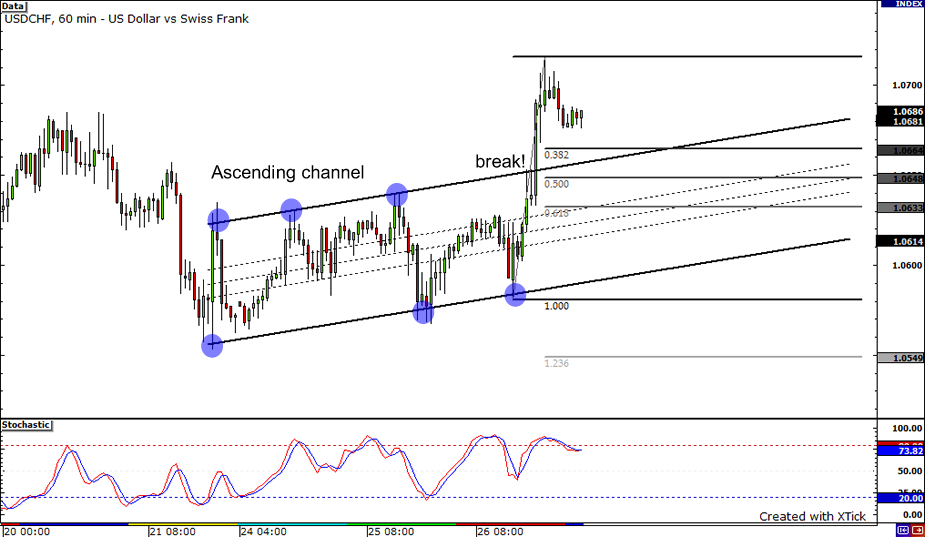
The USDCHF made a nice clean break from the ascending channel formed on the 1-hour chart. The stochastic is currently making its way down from the overbought area, which suggests that the price could slide down for a bit.
The pair could retrace until the 38.2% Fibonacci Retracement level, which intersects the top of the ascending channel, before heading all the way up.Resistance levels are located at the psychologically significant 1.0700 mark and at the previous high of 1.0716. On the other hand, the selling pressure could be strong enough to bring the pair back inside the ascending channel.
GBPUSD: 4-hour
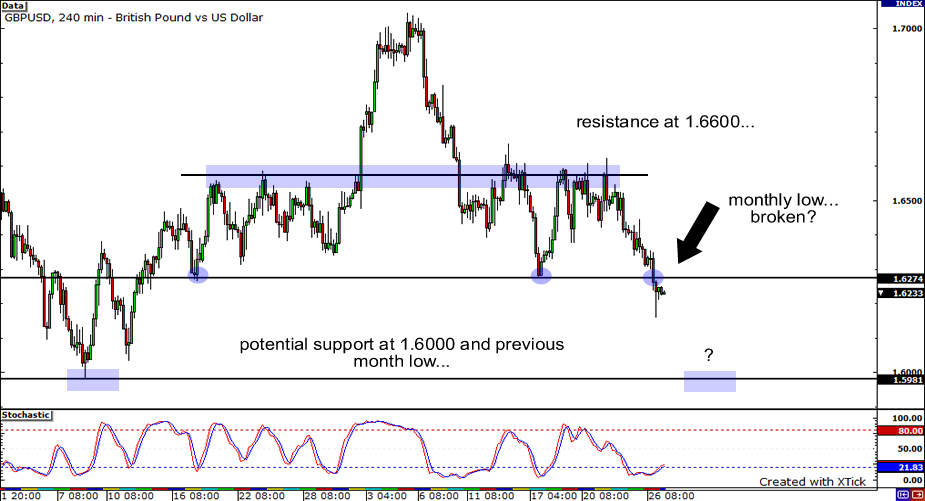
Ouch, the USD gave the GBP another serious beating as it broke through the monthly low support. It looks like the GBPUSD pair is gunning for 1.6000 now. Still, we could see some buying pressures at 1.6100 though as this also served as minor support previously.
On the flip side, if the pair heads upside, 1.6275 would be its first roadblock as this level has now turned resistance. The next potential resistance levels after that would be at 1.6400 and 1.6600 respectively.


