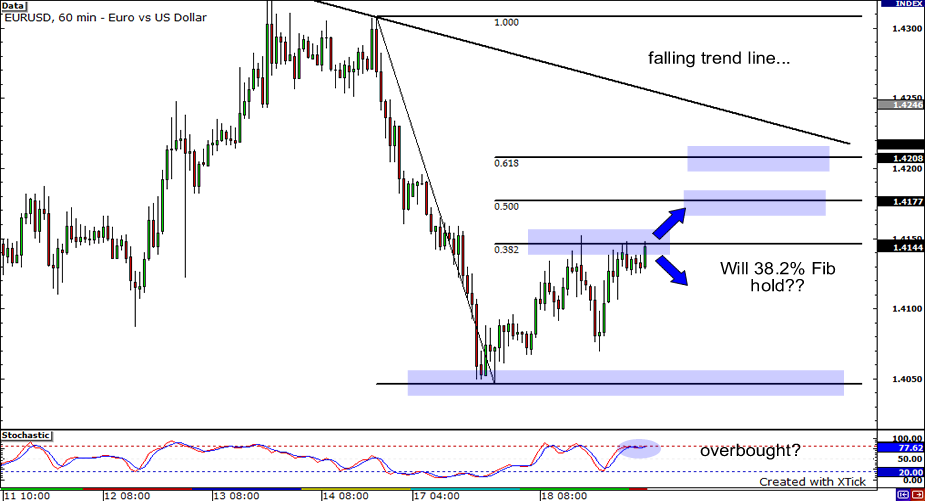
EURUSD: 1-hour
It looks like the EURUSD pair managed to retrace some of its losses yesterday though the move was far from convincing. Price was able to get to the 1.4150 price level, which nicely coincides with the 38.2% Fibonacci level before dropping down again. Still, buyers are refusing to give up as they are currently attempting to take the pair topside again.
If they continue to bring the pair up, they face significant resistance at the 61.8% Fibonacci and falling trend line around the 1.4200 price region. On the other hand, with stochastic indicating that the pair is overbought, sellers could take control and take the pair back down to 1.4050 support.
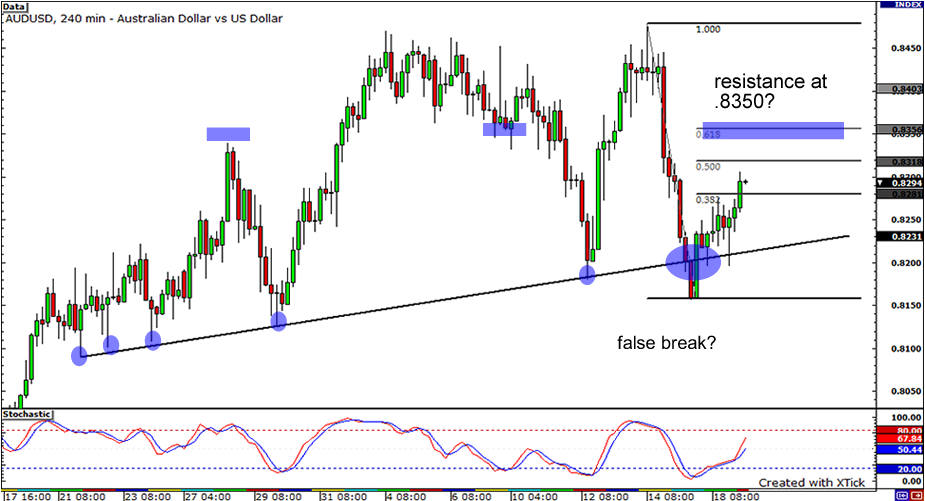
AUDUSD: 4-hour
Here’s an update of the AUDUSD chart I posted a couple of days ago. The pair broke right through support at .8300 and seemed poised to break the trend line… before it shot right back on the top side of the uptrend line. The pair is now shooting to the top and with stochastic not yet in overbought conditions, it looks like it may have enough steam to keep going.
Buyers may encounter some resistance at .8350, which lines up with the .618 Fibonacci retracement level. If the pair does break past .8350, it may look to test for new highs. On the other hand, if it reverses, it may find support at .8250, right about where the uptrend line is approaching.
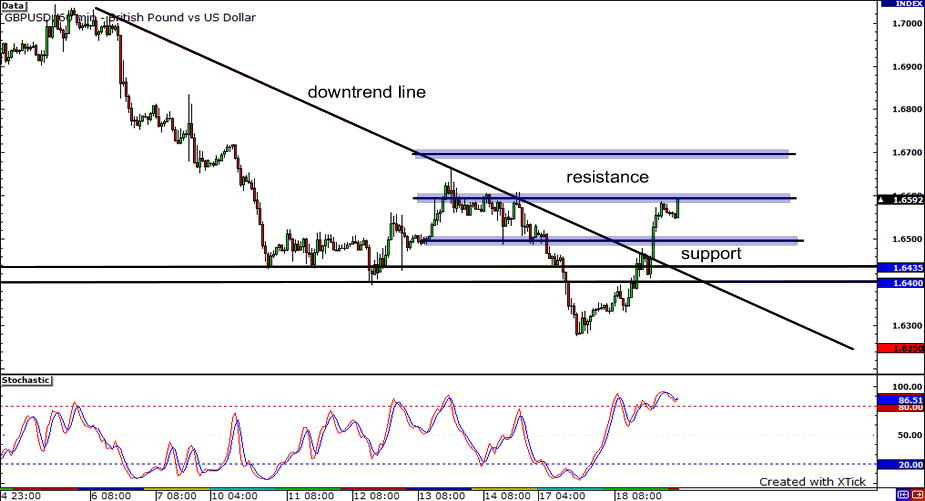
GBPUSD: 1-hour
After piercing through the support at 1.6400, the pair made a “V” turn and sprung back up to break the downtrend line. The pair is now trading near 1.6600 but is seeing some resistance in that area.
The stochastic is already in the overbought territory so the pair may pull back down to 1.6500. However, if risk appetite continues, the pair may have enough juice to push forward all the way to 1.6700.