


USDJPY
Just an update on last week’s price action on the USD/JPY daily chart. The pair is currently resting atop the 50% Fibonacci retracement level, with the stochastic signaling that the next destination could be up north. The price dipped to a low of 94.42, just a few pips below previous support at 94.50, before heading higher.

Recall that the support level at 94.50 was broken a few weeks ago. Soon after, the pair climbed back up and found support at 94.50 again. Notice that a downtrend line can be formed when connecting the highs of the price. If the pair bounces up from the 50% Fibonacci retracement level, it could encounter some resistance on this downtrend line. But if the pair breaks below support yet again, it could dip as low as its previous low of 91.74.
USDCAD

What’s in store for the pair this week? Well, from the looks of it, the 38.2% Fibonacci retracement level at 1.1050 held up pretty nicely last week as price just bounced from it.
It failed to head all the way south though and price is heading topside again… With price registering lower highs and stochastic indicating overbought condition, we might see significant resistance around the 50% Fibonacci retracement level and falling trend line at 1.2000.If 1.2000 doesn’t hold, the 61.8% Fib could be its next stop. Conversely, if price heads south, this year’s low at 1.0633 could provide support for the pair… Be careful though the pair has been consistently registering lower lows in price! It’s hard to tell how low this pair would go if price drops sharply!
AUDUSD
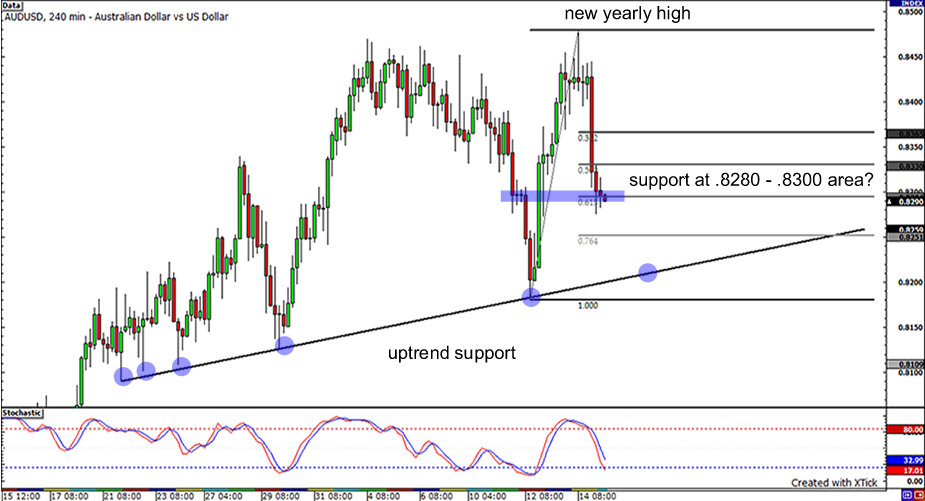
Will you take a look at that – the AUDUSD pair just set a new yearly high at .8479… before dropping like a brick near the end of the week! It seems that although the pair has been trading up and down the past couple of weeks, it has been in an uptrend, as it has reset its yearly highs twice in that span.
Right now, the price action is in an area of interest between .8280 and .8300. These price levels line up closely with the .618 Fibonacci retracement so we may be seeing consolidation as buyers could be looking at this as an opportunity to bring the pair back up.
If sellers dominate the market, we could see further support at the uptrend line. But with price action testing the uptrend support a few times already, could this be the moment where sellers can finally break through? If not, could we see the pair set a new yearly high yet again?


