


AUDUSD: Daily
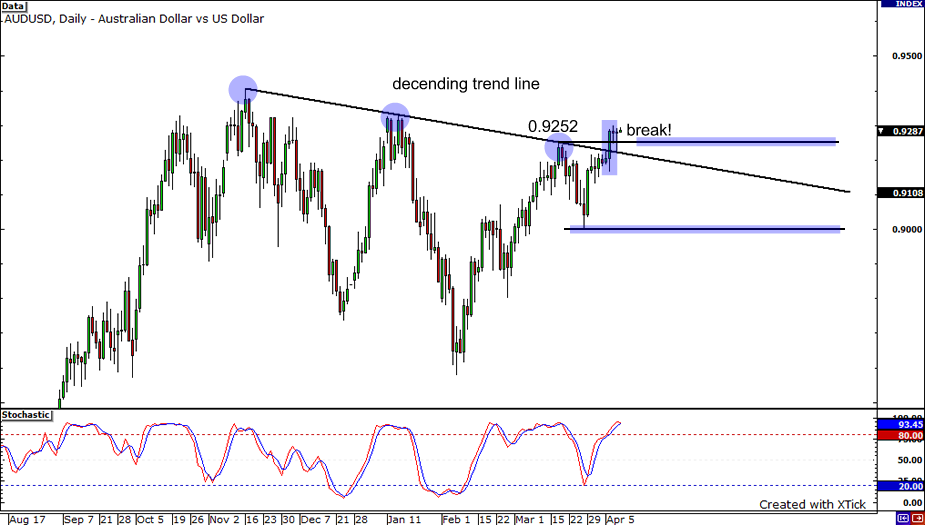
Woah! The Aussie must be pretty stoked after surging above the falling trendline on the daily chart. That was an awesome break, dude! After that strong rally, buyers seemed to run out of energy and may be pausing to catch their breath. This could allow the pair to pull back and retest the broken trend line around the previous month high of 0.9252 again. If the pair moves north, it could go for the 2010 high of 0.9236. Heck, it might even race towards the pair’s yearly high at 0.9407! But if the trend line gets broken, the pair could find itself back at 0.9000.
EURUSD: 4-Hour

Although it’s probably too early to tell, I’m going to go out on a limb here, play forex guru and say that it looks like a huge descending triangle is forming on the 4-hour chart of the EURUSD. Price bounced from support around the the 1.3280-1.3300 region right after a hammer-type candlestick was made. With the falling trend line resistance still far off and stochastics pointing upwards, we could see price rally all the way to 1.3460 before finding sellers. Still, I’d be keeping a close eye on the 1.3400 handle, as price could find some minor resistance at that level.
GBPUSD: 1-hour
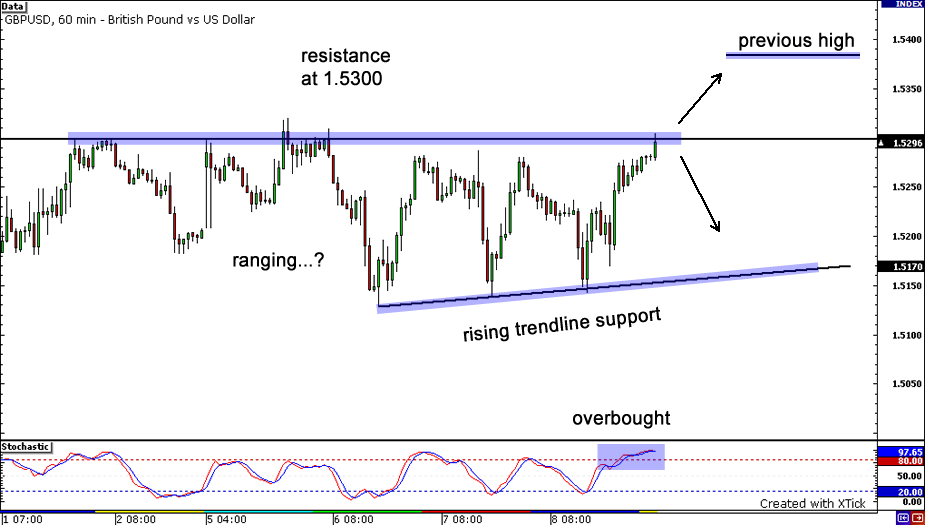
Next, lets hop on over to the GBPUSD. It seems to me that the pair has been ranging as of late, bouncing between a rising trendline and resistance at 1.5300. Price is currently sitting just below resistance, and with stochastics indicating overbought conditions, we may just see sellers jump back in and pull price back down to the support line. On the other hand, if we see a candle close above this week’s high of 1.5320, we may see a retest of former highs at 1.5380.


