


AUDUSD: 1-hour
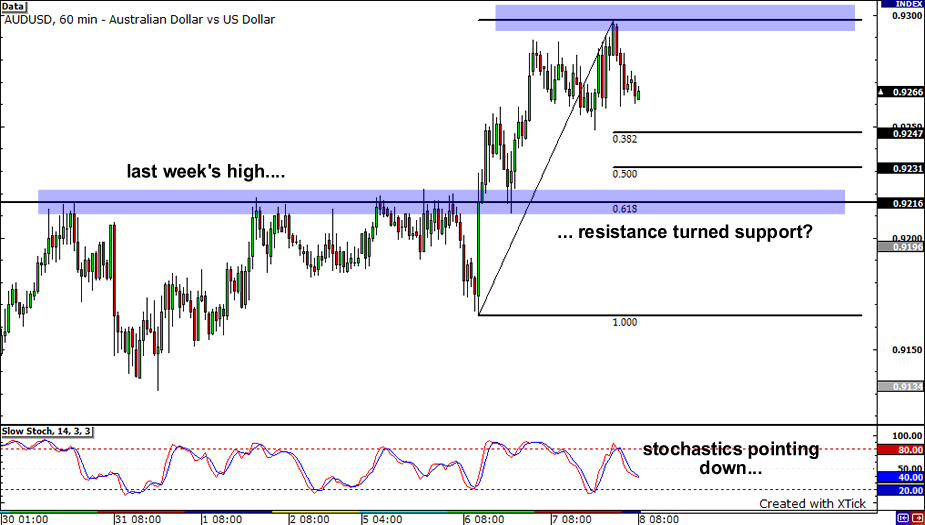
Is it just me seeing this or is the AUDUSD looking pretty heavy? With price failing to bust through the psychologically significant 0.9300 barrier yesterday and stochastics pointing downwards, it looks like there is potential for a retracement. If price does head lower, it probably wouldn’t drop so far. The 61.8% Fibonacci retracement level, which coincidentally lines up nicely with the previous week’s high, will be tough to break for the bears. Watch out for the 0.9216 level closely, as we could see a lot of buyers in this area.
NZDUSD: 4-hour

Taking a look at the 4 hour chart of the NZDUSD, it seems that the pair has been consolidating as of late, although it has been respecting a falling trendline. With stochastics indicating overbought conditions, the pair may continue to consolidate as sellers jump back in to play. Sellers though, could find some support at 0.6970, which has been an area of interest in the past. Now, if for some reason the falling trend line fails to hold, look for price to test former highs at 0.7170.
USDCAD: Daily
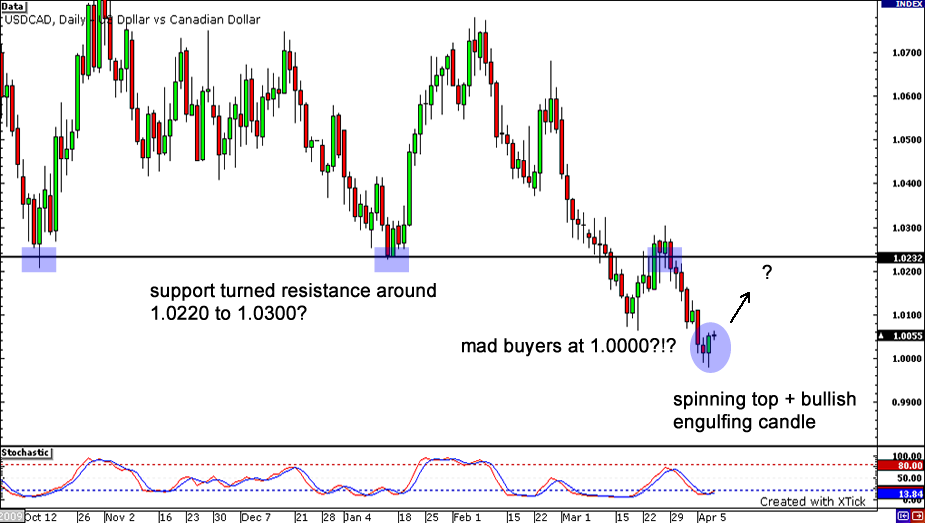
Yes, the USDCAD has hit parity… but for how long? With price failing to close below the significant 1.0000 mark, could a retracement be in the cards? After all, the past couple of days, we’ve seen a spinning top and a bullish engulfing candle form on the daily chart, so we may be seeing buyers begin their run. If buying pressure remains strong, we could see price rise back up to former areas of interest between 1.0220 and 1.0300.


