


Trade Closed: 2007-11-19 17:57
Good evening! Sorry about the late update, but me and a few of the FX-Men decided to take a last minute trip to the Trading Expo in Las Vegas! It was a great trip as we got to meet some great traders and take a chance to check out some what’s out there as far as Forex products! If you’re new and if you have an opportunity to check out an event like the Expo, I highly suggest you do because there’s no better way to learn than from another trader!
While we were away, our trade did manage to trigger on a quick move down the same day I posted the idea. It was enough to trigger our trade and hit our first profit target, but the pair retraced from there to close out our remaining position at break even.
1st Half: +50 pips
2nd Half: +00 pips
Total: +50 pips
So, we managed to lock in 50 pips. It looks like the pair bounced off of the 240 MA’s on the retracement and resumed its downtrend as it trades below the psychologically important level of 110.00. As equities continue to weaken look for the pair continue its decent as more risk aversion appears to be in the cards for USD/JPY in the short term. Well its great to be back, so stay tuned for a new trade idea later tonight!
Trade Idea: 2007-11-14 08:15
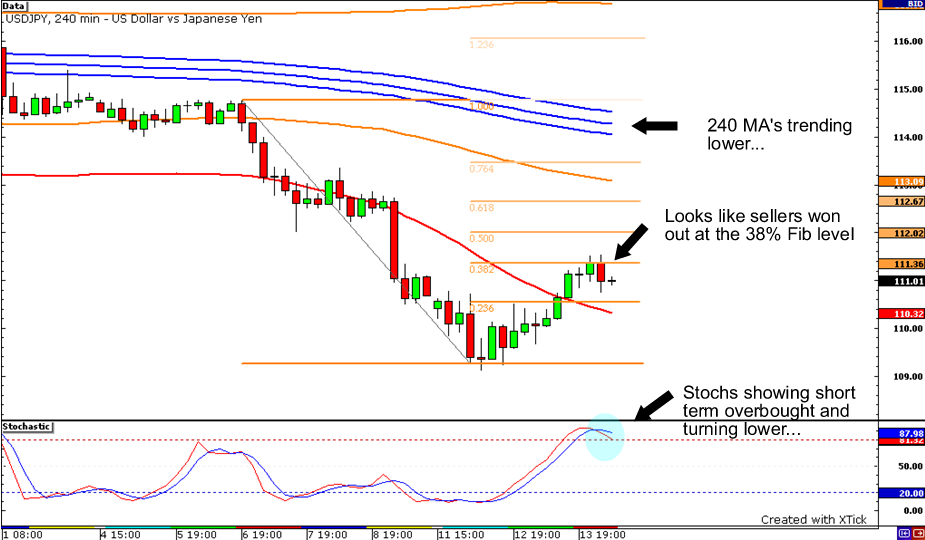
Good morning! We have a nice Fibonacci setup that may get us back in the downward momentum in USD/JPY.
To support our short idea, we can see 240 MA’s trending lower, so a short may still be the high probability direction. Stochastics are showing short term overbought and may be turning at this point. Also, we can see a bearish bar at the 38% Fibonacci level showing seller took control at that point and that momentum may switch from the counter trend rally to the downside.
We do have economic events today with the US PPI and Retail Sales coming out very soon at 8:30 am EST. Inline or weaker numbers may support our trade as weaker inflation may steer the Feds focus a little more on economic growth. If we see weaker Retail Sales number, look for the US Dollar to move lower.
So, we will short below the previous bar’s low, with a wide stop, and we’ll see if we can retest recent lows.
Short USD/JPY at 110.50, stop at 111.50, pt1 at 110.00, pt2 at 109.00
If our position does reach 109.00, instead of closing position we will adjust stop on any remaining positions.
Remember to never risk more than 1% of your account on any single trade. Adjust position sizes accordingly.
Stay tuned for updates. Good luck and good trading!
This content is strictly for informational purposes only and does not constitute as investment advice. Trading any financial market involves risk. Please read our Risk Disclosure to make sure you understand the risks involved.


