


USDCAD: 4-hour
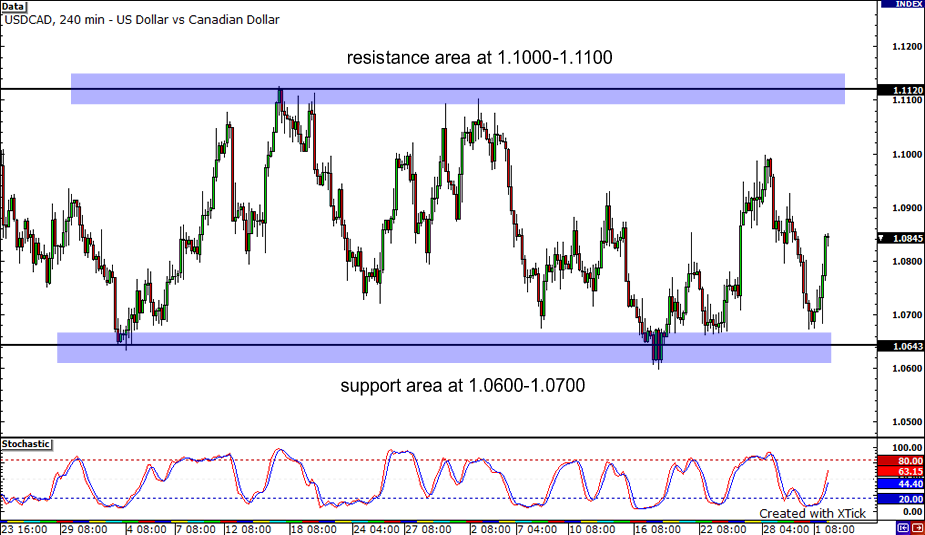
Range-bound is the name of the game for the USDCAD as it is sitting right smack at the middle of its trading range. There two important areas of interest here: the resistance area at 1.1000-1.1100 and the support area at 1.0600-1.0700. Notice how price action bounced multiples times from these levels since the beginning of the year. Now, if the upward move continues, we might see the pair encounter resistance at 1.1000. On the other hand, if it heads down, sellers could target 1.0600, the previous month’s low.
GBPUSD: 4-hour

Let’s now cover the cable using Elliot wave analysis. Based on the Elliot Wave Theory, prices usually move in a 5-3 wave pattern. The first 5 waves are impulse waves while the last 3 are corrective waves. Waves 1, 3, and 5 in the first big wave are motive waves which move in the direction of the trend. Among these, wave 3 is usually the longest and strongest wave. If my wave counting is correct, then we should be riding on a wave 5 already. Hence we could be seeing a correction some time soon. Though, the price could very well re-visit wave 3’s swing low, which is also the pair’s 3-month low. It could even go lower to 1.5700. On the other hand, it is also possible for the pair to take a pause and move back up to 1.6000.
AUDUSD: Daily
Now, let’s take at the daily chart of the AUDUSD pair. The has been on a nice run the past 6 months, and has recently been hitting new yearly highs. The pair is showing some signs of a possible pullback, as yesterday’s candle has formed a bearish engulfing pattern. If the pair does continue to head to the downside, it could once again test the long term trend line, with potential support at .8600. If however, sellers do dominate the market, it could break the trend line, and test potential support at previous resistance around .8480. On the other hand, if the trend line holds, we could be in for a bounce, and the pair could attempt to hit test prior highs around .8800.


