


USDCHF: 4-Hour
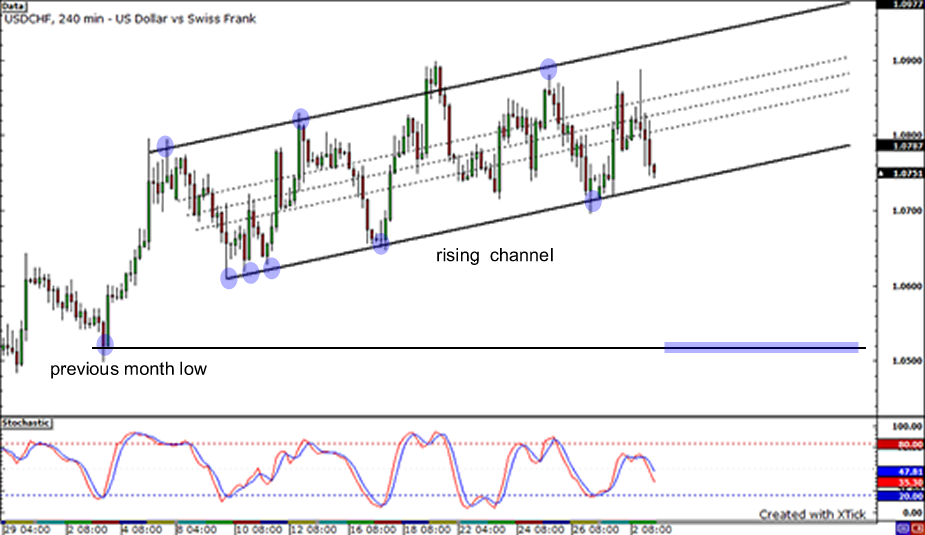
Check out the USDCHF 4-hour chart I posted above. Notice that nice rising channel in which the pair has been stuck in? Well, the pair is currently approaching the bottom of the channel, from which it could bounce. Once it does, it could climb back up to retest the top of the channel. However, the pair has been forming lower highs recently, suggesting that the sellers could eventually take the upper hand. Aside from that, the stochastics still haven’t made their way to the oversold region yet, suggesting that the downward movement is not overdone. If the pair breaks below the bottom of the channel, it could fall all the way down and find support at the previous month low near the psychological 1.0500 handle.
NZDUSD: 1-Hour
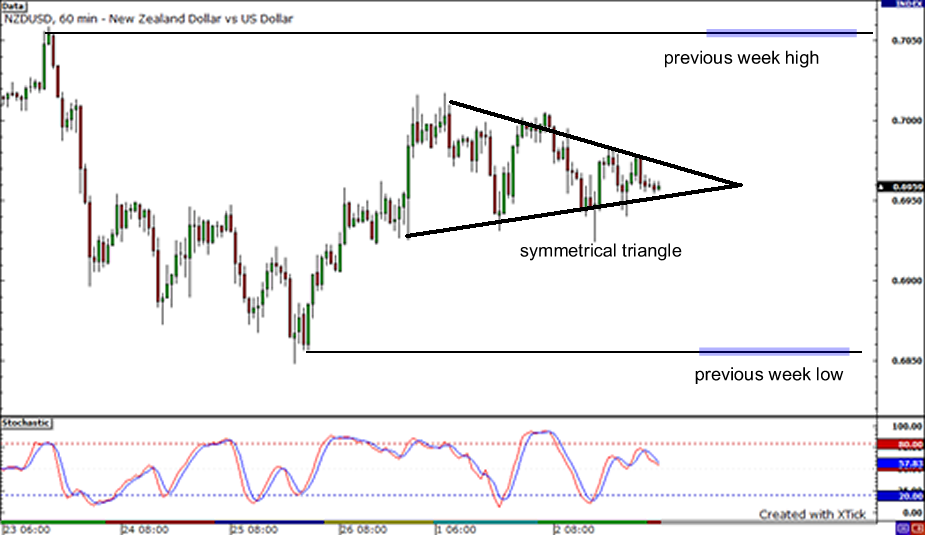
Moving on to the Kiwi… I spotted a neat symmetrical triangle formation on the 1-hour chart as the pair paused to consolidate after last week’s strong moves. Could it be prime for a breakout soon? And in which direction? If it breaks to the upside, it could surge up and encounter resistance around the previous week high of 0.7060. On the other hand, if it breaks below the bottom of the triangle, it could tumble down to its previous week low of 0.6850. Note that the stochastics are still on middle ground, suggesting that the pair can go either way!
USDCAD: 1-Hour

Next is the USDCAD on its 1-hour chart. As you can see, the Loonie came back with a vengeance yesterday, trumping the greenback. The USDCAD fell and settled at 1.0365 from 1.0418, surpassing February’s low. The pair, however, appears to have corrected back to the 38.2% Fibonacci retracement level that I drew. It could soon fall back to its yesterday’s low if it fails to move past above the 38.2% and 50% Fibs and the support-turned-resistance at 1.0371. But if it does, the 61.8% Fib, which is very near the 1.0400 handle, could provide the pair some resistance.


