


USDJPY: 1-hour

Let’s start things with a quick look on the hourly chart of the USDJPY. After the pair’s steep run up, the pair found itself consolidating, bouncing around a nice descending triangle. Notice how the USDJPY is gradually making lower highs but is unable to post lower lows. MOST, I repeat, MOST of the time, a descending triangle signals a downside break. If support at 92.25 breaks, the pair would probably fall to 91.70 before finding buyers. On the flip side, if the breakout is upwards, a retest of 92.95 is likely.
EURJPY: Daily
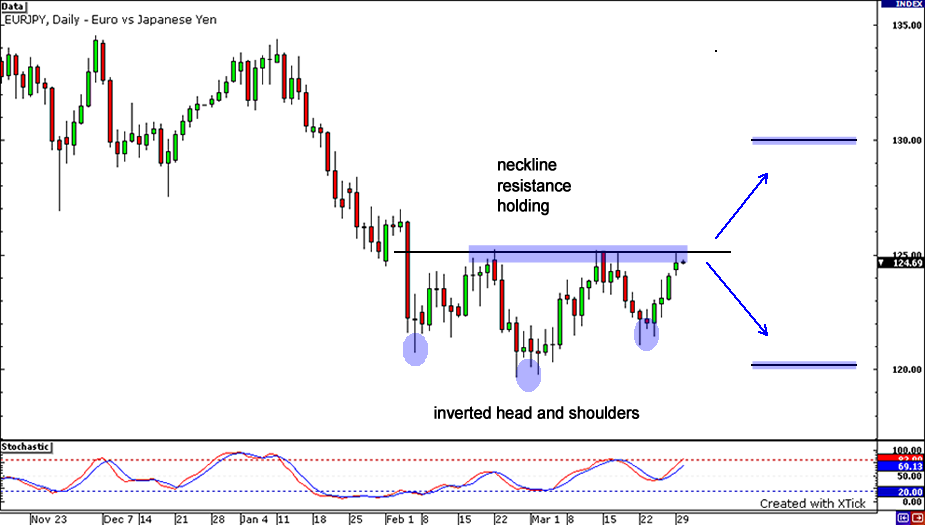
Looks like that huge inverted head and shoulders on the EURJPY daily chart has come to life! The neckline resistance at 125.00 seems to be holding tight though. If buyers decide to bust that line up, we could see the pair rise all the way up to 130.00, which is equal to the distance between the head and neckline. On the other hand, if sellers come back to dictate the pace, they could push price all the way down to test lows at 121.50 and 120.00.
GBPJPY: Daily

Is the Guppy’s 4-day rally coming to an end? It sure does look like it as the pair is finding resistance at the 139.00-139.20 region, right at the 38.2% Fibonacci retracement level and former highs. Additionally, stochastics is about to hit overbought territory, which usually signifies that buyers are starting to run out of steam. If we see resistance hold, watch out for move towards 132.00, this year’s lowest price level. Conversely, if a daily candle manages to close above the 38.2%, the pair’s next stop would probably be the 61.8% Fib.


