


GBP/JPY: 4-hour
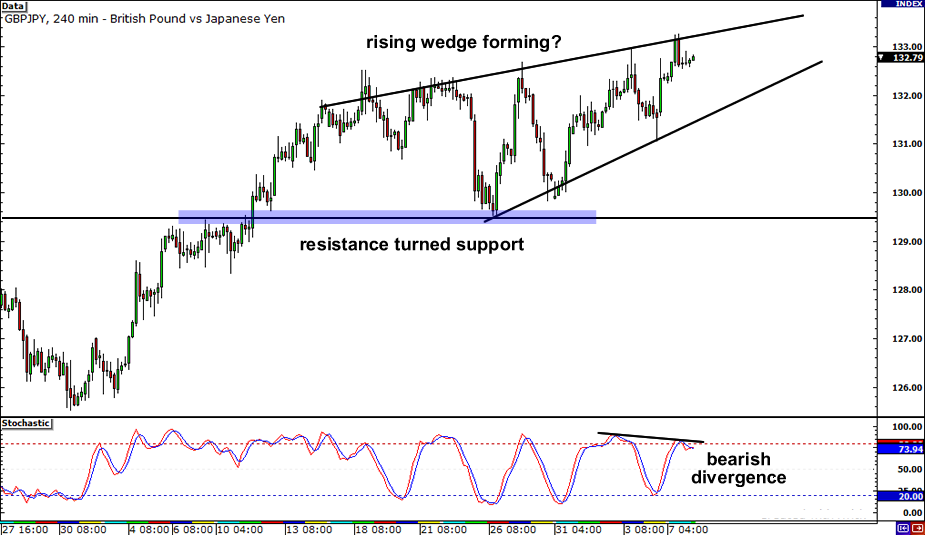
Go guppy! The pair just keeps climbing higher, doesn’t it? Well, it looks like its uptrend could come to an end with that rising wedge formation on the 4-hour chart. According to our awesome School of Pipsology, a rising wedge that forms during an uptrend usually signals a reversal, so better hold on to your hats fellas! With that bearish divergence right there, we could be in for a wild drop. If the pair breaks below the bottom of the wedge, it could fall until that resistance turned support level at 129.50.
USD/JPY: 4-hour
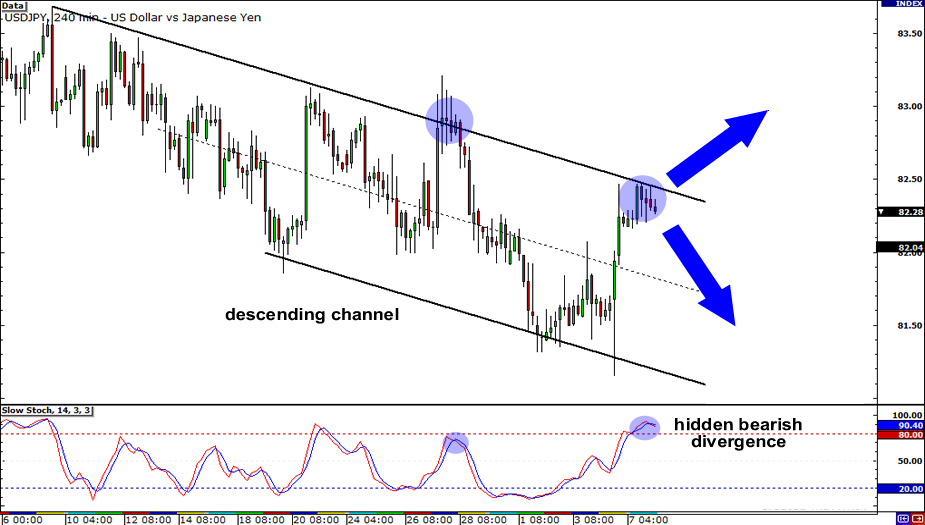
Yo shawty! You feel like shortin’ today? If that’s a yeah, then you’re gonna dig USD/JPY! Looking at the 4-hour chart, we see that the pair is trading on a descending channel. Making it even more appealing to the bears is the bearish divergence that stochastic is showing. If there are enough sellers chillin’, we may just see the pair trade lower to test support at its previous low, around 81.20. But don’t get too giddy just yet. Who knows, bulls may push the pair past the resistance at the top of the channel and tap the 83.00 handle.
EUR/AUD: Daily
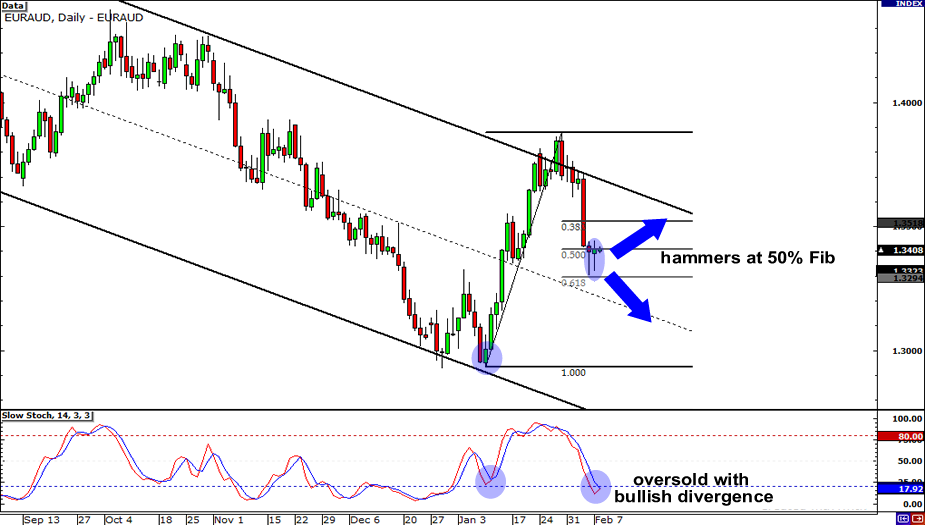
Also cruisin’ down the charts is EUR/AUD. However, with the pair forming a couple of hammers at the 50% Fib and stochastic sportin’ a bullish divergence, could we see EUR/AUD take a detour and test resistance at 1.3700? Hmmm, maybe. I wouldn’t be too hasty rootin’ for the bulls though. Remember that the trend is your friend. The Aussie may just get a lot of lovin’ from traders today and EUR/AUD could skid down to 1.3000.


