


EURUSD: Daily
Look at that double head fake on the EURUSD daily! From the looks of it, the EURUSD pair has generally been ranging with a slight bias on an upside movement.
It seems like buyers are having a very difficult time sustaining upward momentum every time the pair breaks out.
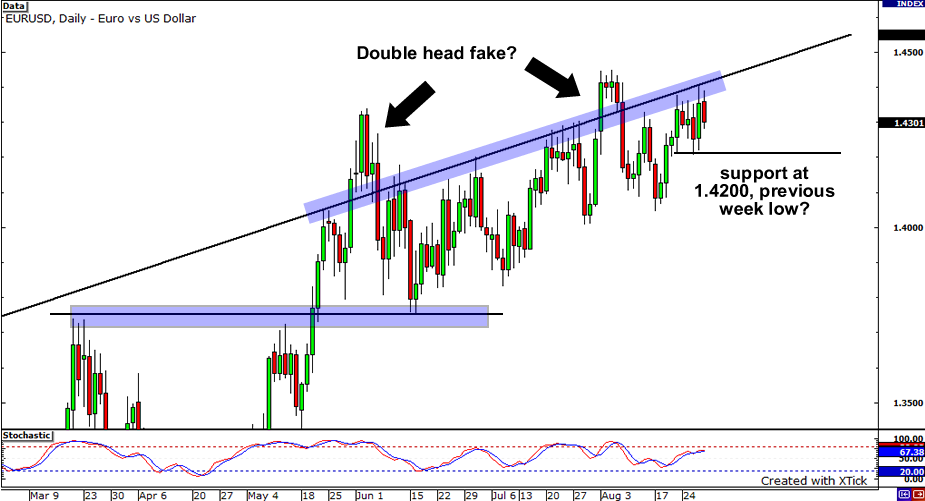
If the pair heads north, resistance could be found at 1.4400, the previous week’s high, and 1.4500, a psychological price.
Conversely, if the pair goes on a trip south, support could be found at 1.4200, the previous week’s low, and 1.4000, another psychological price level.
NZDUSD: 1-hour

Side-to-side. That’s exactly how the NZD/USD has been moving for the past several days. The pair attempted to break above the resistance of the range quite a few times but it was unsuccessful in doing so.
Currently, it is trading below 0.6850. It may see this level as a minor resistance that can push the price further down to 0.6800.On the other hand, we may see the pair head up all the way back to the range’s resistance if it manages to move above 1.6850.
EURJPY: Daily

Respect! That’s what’s the EURJPY pair has been about lately, as it has respected the downtrend line that has formed since it peaked at 138.72. The pair has seen some support at the 133.00 price level. Combining this support level with the downtrend line, it seems that a descending triangle is in play.
At the same time, however, the pair has formed a head and shoulders pattern on the daily chart! We could see some major breakouts at play! If the pair breaks the downtrend line, we could see it shoot up and test previous highs around 136.00.
If however, it doesn’t respect the 133.00 necklines, could we see the pair make a clean break to the downside?
By the way, don’t forget to check out our other creations! Check them out and please, let us know what you think!


