


NZDUSD
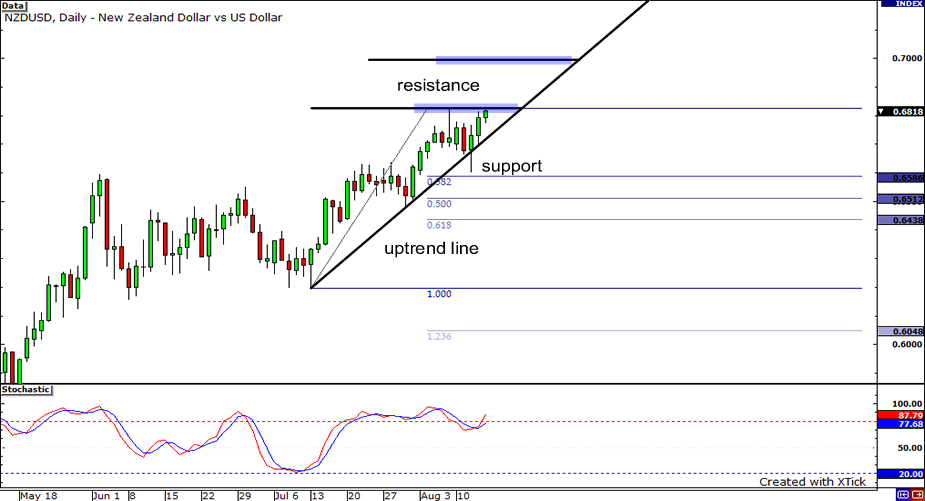
A daily chart of NZD/USD is shown above. The other day, it seemed like the pair was going to break below its intermediate uptrend line. Luckily, it was able to bounce back up from its 38.2% Fibonacci retracement level. The price is now back trading above the uptrend line. The pair can reach 0.7000 if the it can move past the current week’s high. On the other hand, it may hit a resistance at the current week’s high which can send it back near the uptrend line.
USDCHF
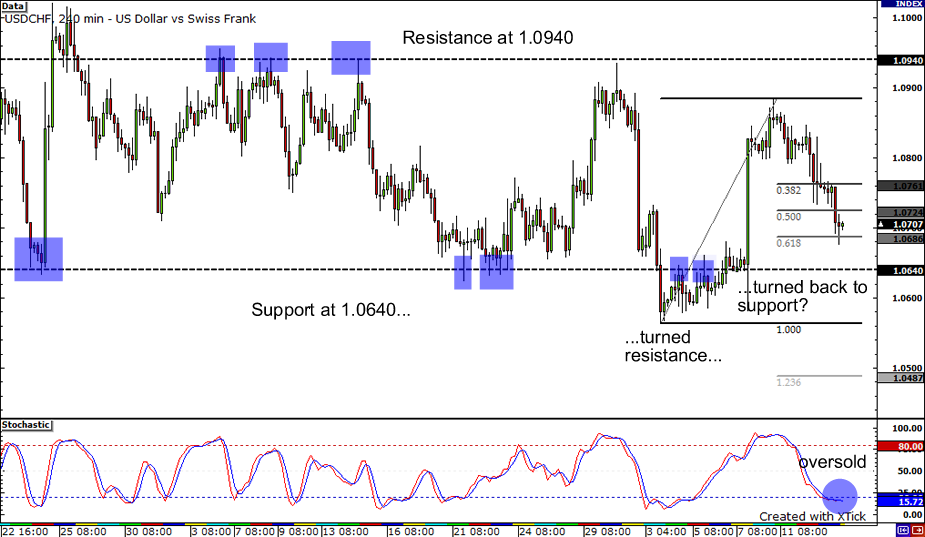
The USD/CHF is currently making its way to the bottom of its old range, with support at 1.0640. This support level was broken a few days ago and it served as a resistance level for a while. When the pair jumped back in the range, it didn’t even make it to the resistance level at 1.0940 on its last uptrend. Now, if you draw a Fibonacci tool on the latest upswing, you’d see that the pair is currently resting atop the 61.8% retracement level. The stochastics is already in the oversold area and is waiting to move up to the overbought region. The pair might rebound from the 61.8% Fibonacci level or dip a little lower to the bottom of the range then head upwards.
EURUSD

Here’s an update on the EURUSD! Yesterday I mentioned 1.4300 would provide significant resistance for pair for three reasons: it is psychologically significant, it coincides with the 61.8% fib and stochastics indicates that the pair is overbought. It seems that is what exactly happened as a doji candlestick pattern has formed on the four-hour chart right smack at 1.4300. Is this a sign of a reversal? I don’t know exactly but if price does head southwards, major support could be found at 1.4150 and 1.4000. On the other hand, if the pair continues its upward move, there will be significant resistance at this year’s highs at the price region at 1.4450.


