


GBPUSD

A 60-minute portrait of GBP/USD is shown above. After breaking the rising trendline, the pair failed to close above 1.6800. It attempted to do so a couple of times but the buyers did not have much juice to push the price above the said mark. Rather, the pair fell down and even pierced through the support at 1.6700. 1.6700, as of the moment, acts as a resistance for the GBP/USD. The price can move down to 1.6600 if it doesn’t close above 1.6700. On the other hand, the price can reach 1.6800 if it can close above 1.6700.
USDCAD
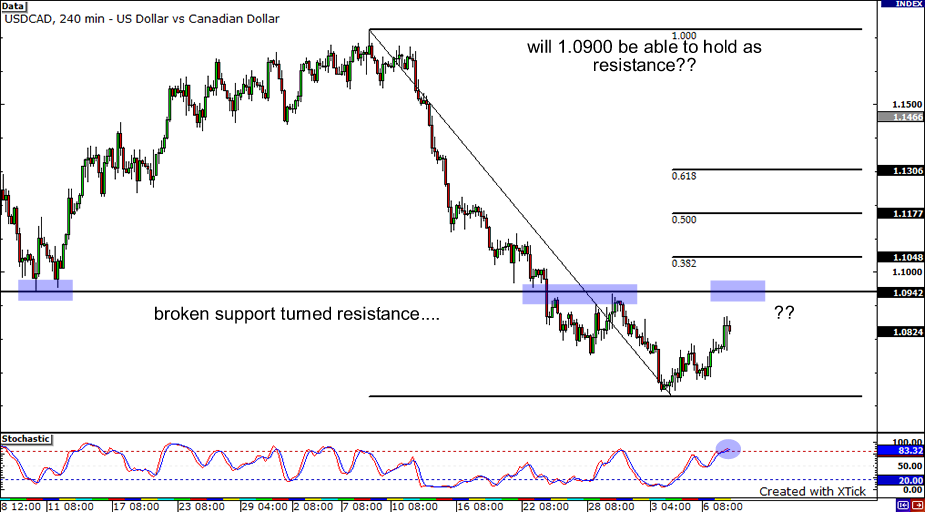
A correction or a new trend? That’s probably the question that’s going on the minds of many traders right now as price of the pair seems to be heading towards 1.0900. We might see significant resistance around 1.0900 as this price region served as support for the pair. If Friday’s rise up was merely a retracement and 1.0900 holds, the pair’s next downside targets would be 1.0750 and 1.0600 respectively. On the other hand, if buyers break 1.0900, potential resistance could be found around the 38.2% Fibonacci level. This Fib level also nicely coincides with the 1.1000 region, a psychologically round number.
AUDUSD
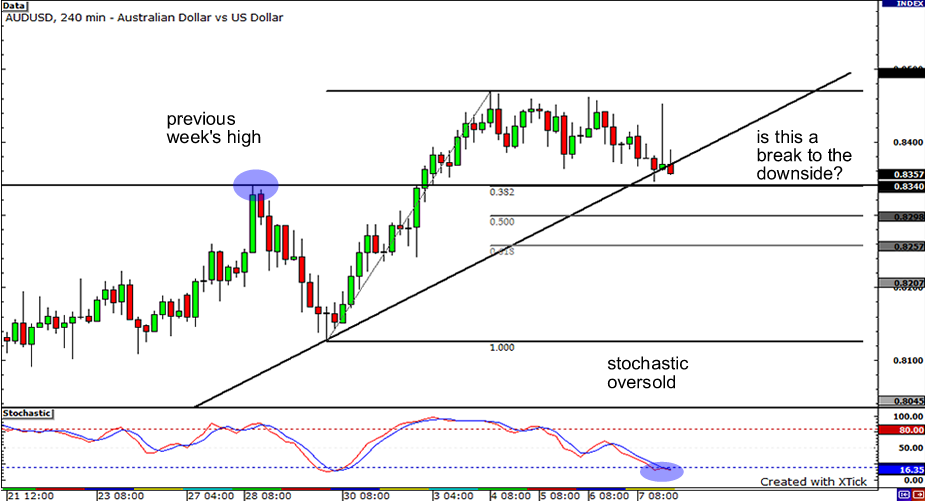
The AUDUSD trickled down lower last week, as the AUD buying waves died down a bit. Could we see the AUD regain some momentum as it approaches potential support areas? Firstly, price action is testing the recent uptrend line. Secondly, it is approaching the 38.2% Fibonacci retracement level, which also lines up with the previous week’s high at 0.8340. Stochastics is also indicating that the pair is oversold. The pair could see further support at 0.8250, which lines up closely to the 50.0% Fibnacci level, and could also serve as psychological support. Then again, sellers may make a strong push and break all these support levels!


